")
")
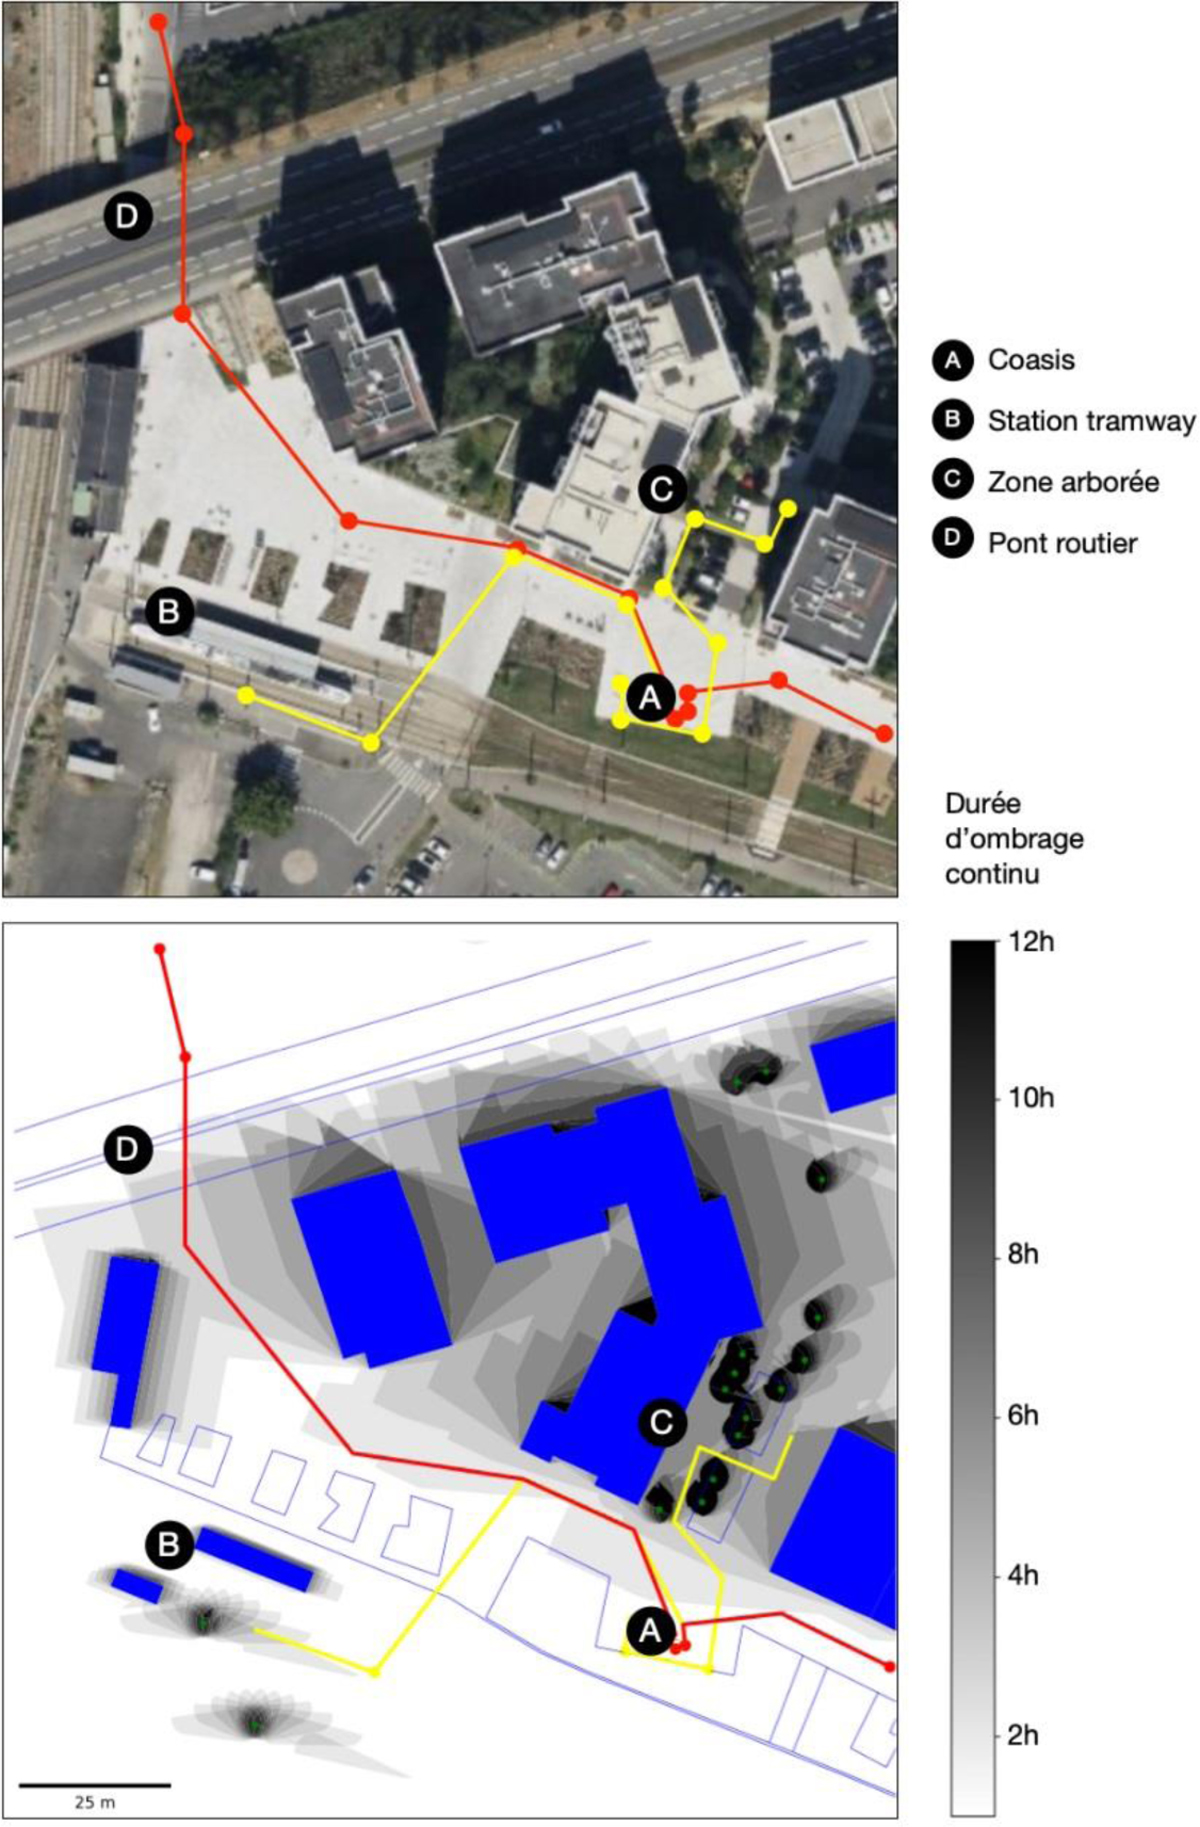
Figure 3
Download original image
En haut, vue aérienne du site d’implantation avec les deux parcours de mesure (trait rouge et trait jaune). © Photo aérienne Bing Maps. En bas, simulation des ombrages cumulés montrant la durée d’ombrage continue dans la zone le 11 juillet entre 9 h et 21 h (heures locales). © T. Leduc / AAU-Crenau.Above, aerial view of the site with the two measurement paths (red line and yellow line). © Aerial photo Bing Maps. Bottom, cumulative shading simulation showing the duration of continuous shading in the area on July 11 between 9 a.m. and 9 p.m. (local time). © T. Leduc / AA U-Crenau.
Current usage metrics show cumulative count of Article Views (full-text article views including HTML views, PDF and ePub downloads, according to the available data) and Abstracts Views on Vision4Press platform.
Data correspond to usage on the plateform after 2015. The current usage metrics is available 48-96 hours after online publication and is updated daily on week days.
Initial download of the metrics may take a while.