Figure 3

Download original image
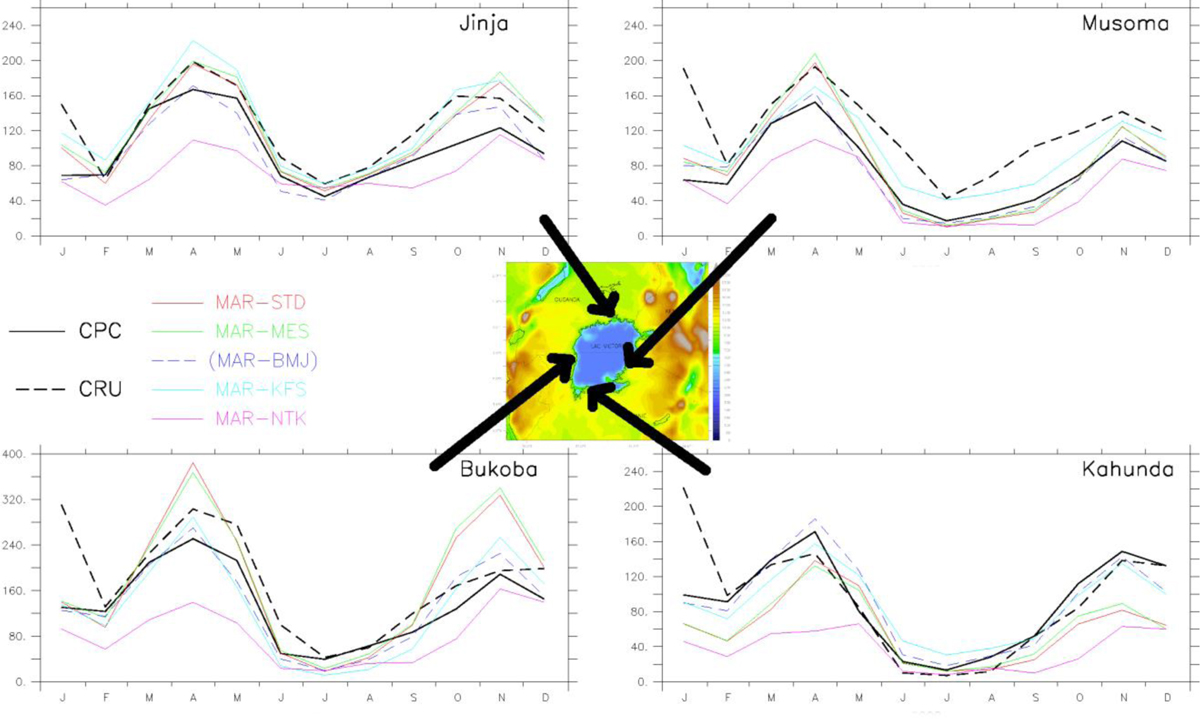
Moyennes des cumuls mensuels de précipitations (en mm/mois) simulées par MAR avec chaque schéma convectif (lignes continues en couleurs) et fournies par les données CPC (lignes noires continues) et CRU (lignes noires discontinues) sur la période 1987-2017 pour quatre villes situées sur les rives du Lac Victoria (Afrique équatoriale de l’Est) et pointées sur la carte avec les flèches noires. La simulation MAR-BMJ (ligne pointillée bleue) a été normalisée afin que la moyenne annuelle des précipitations corresponde à la moyenne annuelle des précipitations dans les données CPC. Attention : l’axe des ordonnées pour la ville de Bukoba est différent des autres villes.
Mean monthly rainfall (in mm/month) simulated by MAR with each convective scheme (solid colored lines) and provided by CPC (solid black lines) and CRU (dashed black lines) data over the period 1987-2017 for four cities located on the shores of Lake Victoria (Eastern Equatorial Africa) and pointed on the map with the black arrows. The MAR-BMJ simulation (blue dashed line) has been normalized so that the annual mean rainfall matches the annual mean rainfall in the CPC data. Note: the y-axis for Bukoba City is different from the other cities.
Current usage metrics show cumulative count of Article Views (full-text article views including HTML views, PDF and ePub downloads, according to the available data) and Abstracts Views on Vision4Press platform.
Data correspond to usage on the plateform after 2015. The current usage metrics is available 48-96 hours after online publication and is updated daily on week days.
Initial download of the metrics may take a while.


