")
")
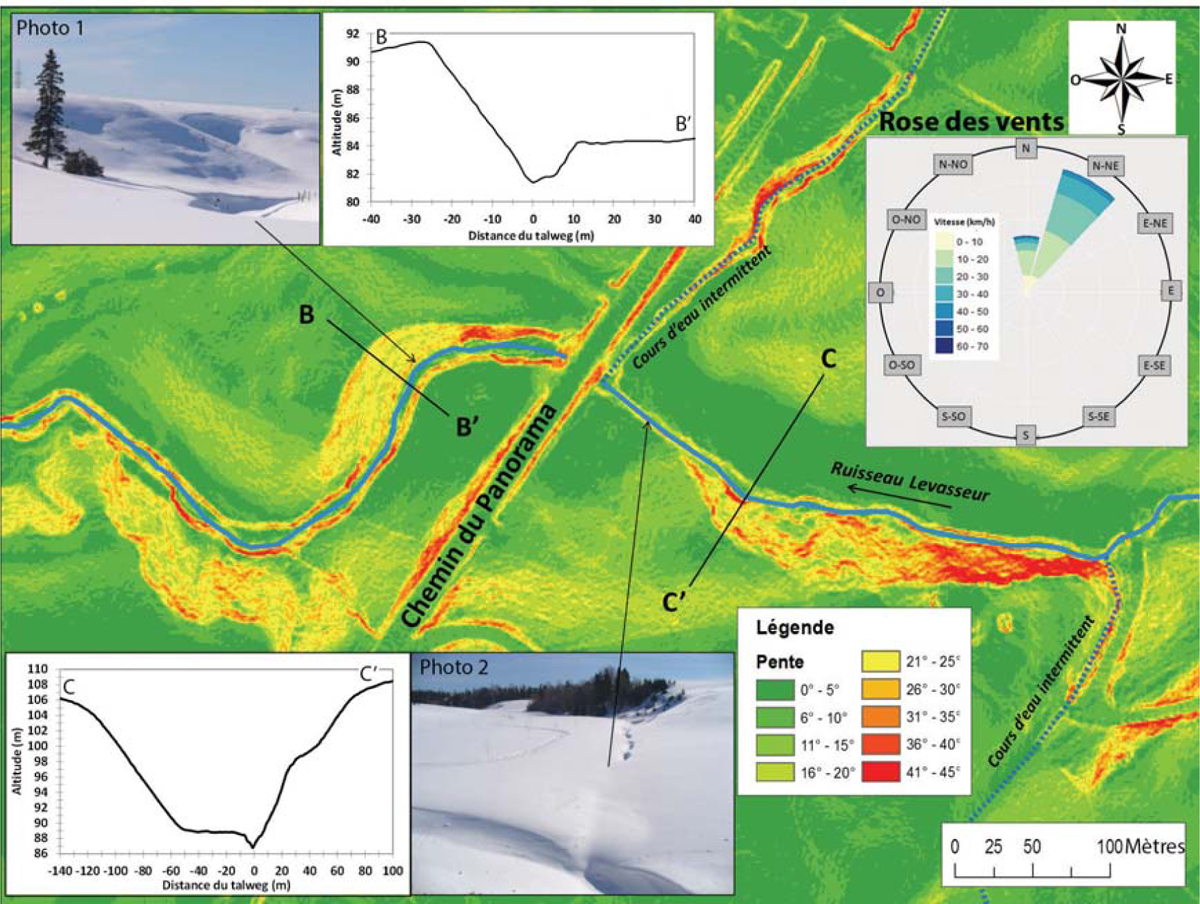
Figure 9
Download original image
Carte des pentes de la partie amont du Ruisseau Levasseur. Localisation de la zone représentée sur la figure 8. Photo du bas, près du profil tranversal C-C’ : ruisseau comblé de neige soufflée dans la zone de départ de la coulée de slush. La rose des vents en haut à droite couvre la période allant du 1er novembre 2005 au 15 février 2006. Map of the slopes of the upstream part of Levasseur Creek. Location of the area shown in Figure 8. Bottom photo, near the transverse profile C-C ‘: filled creek of snow blown into the starting area of the slush flow. The wind rose top right covers the period from November 1, 2005 to February 15, 2006.
Current usage metrics show cumulative count of Article Views (full-text article views including HTML views, PDF and ePub downloads, according to the available data) and Abstracts Views on Vision4Press platform.
Data correspond to usage on the plateform after 2015. The current usage metrics is available 48-96 hours after online publication and is updated daily on week days.
Initial download of the metrics may take a while.