")
")
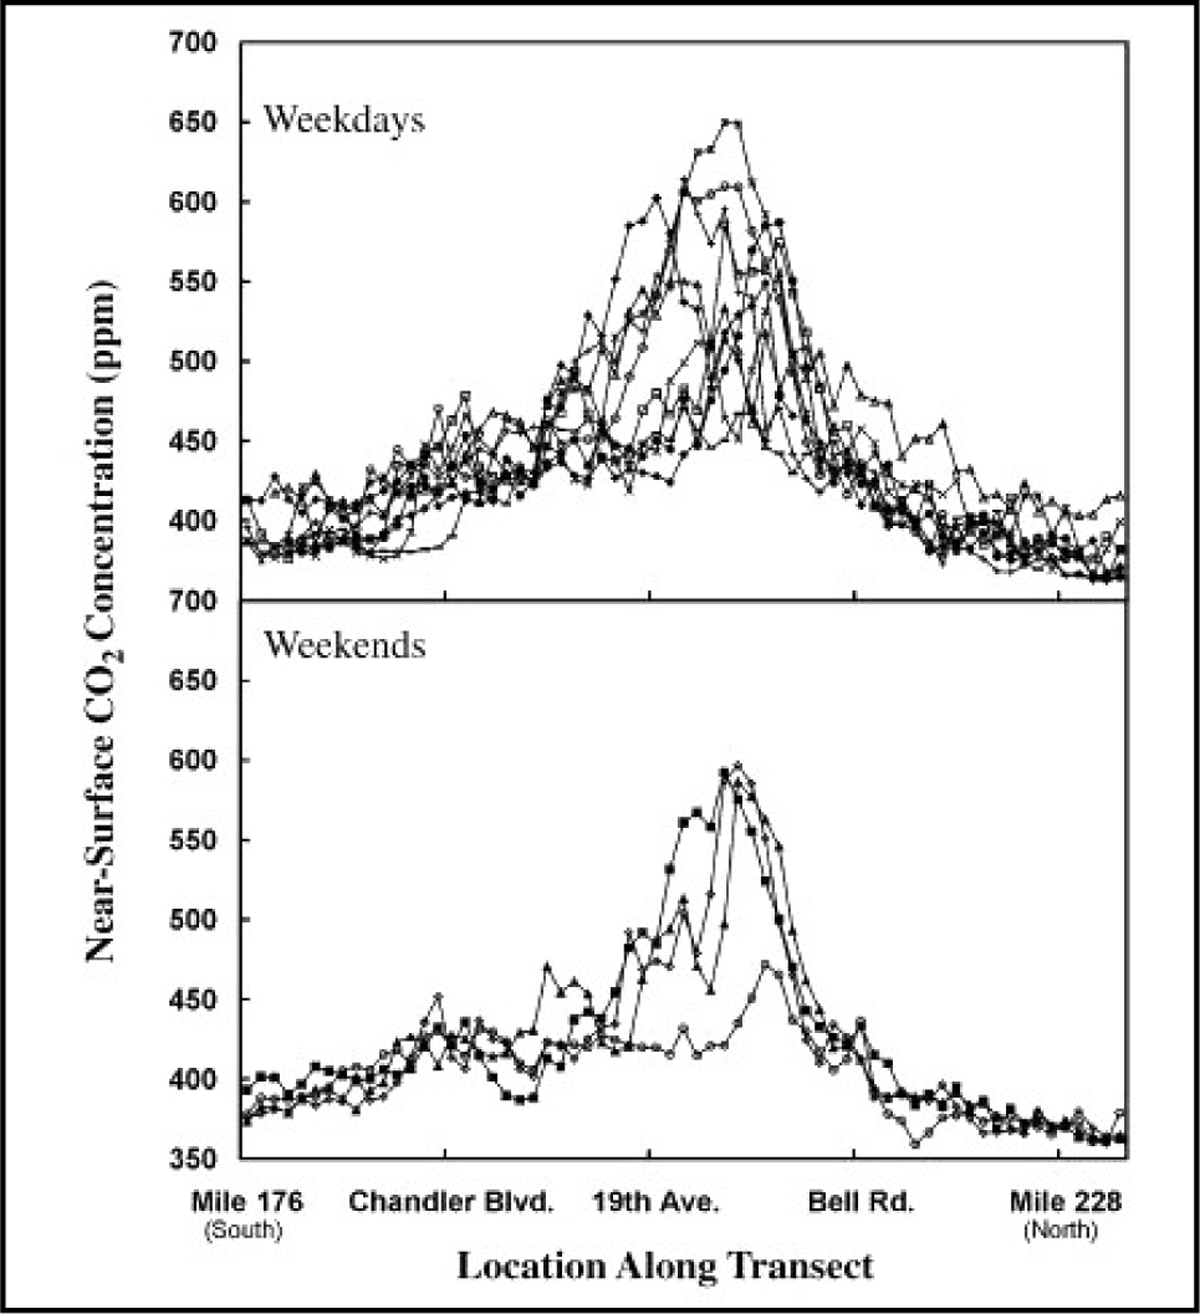
Figure 8
Download original image
Une représentation de la pollution urbaine proche de celle de l’îlot de chaleur : concentration de CO2 à Phœnix (États-Unis d’Amérique), en janvier 2000, le long d’un transept Sud-Nord, les jours de semaine (en haut) et les week-ends (en bas). Les noms des lieux en abscisse divise le transept en quatre segments de longueur égale (d’après Idso et al., 2000). Heat island-like urban pollution representation: CO2 concentration in Phoenix (USA), during weekdays (top) and weekend (down) of January 2000, on a South-North transect. The named locations along the abscissa divide the route into four equal-length segments.
Current usage metrics show cumulative count of Article Views (full-text article views including HTML views, PDF and ePub downloads, according to the available data) and Abstracts Views on Vision4Press platform.
Data correspond to usage on the plateform after 2015. The current usage metrics is available 48-96 hours after online publication and is updated daily on week days.
Initial download of the metrics may take a while.