")
")
Tableau 2
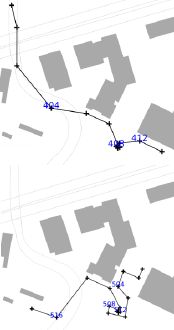
Circuits de mesures réalisés et températures d’air relevées sur place par la sonde Kestrel-5400. Sur les plans des parcours, certains points de référence sont numérotés pour faciliter l’interprétation des graphiques de la figure 4 ci-après. Measurement circuits and air temperatures measured on site by the Kestrel-5400 probe. On the route plans, some reference points are numbered to facilitate interpretation of the graphs in figure 4 below.
| Plan des parcours. Les 2 parcours sont réalisés lors de chacun des 8 circuits | Circuits | Plage horaire | Température d’air (°C) | |||
|---|---|---|---|---|---|---|
| N° | Date | Début | Fin | Début | Fin | |
 |
1 | 11/7/22 | 10h56 | 11h22 | 26,5 | 26,2 |
| 2 | 11/7/22 | 13h03 | 13h23 | 28,5 | 28,8 | |
| 3 | 11/7/22 | 15h23 | 15h47 | 30,5 | 31,2 | |
| 4 | 11/7/22 | 17h20 | 17h39 | 32,6 | 34,7 | |
| 5 | 13/7/22 | 11h42 | 12h01 | 33,8 | 34,2 | |
| 6 | 13/7/22 | 13h52 | 14h11 | 34,8 | 35,7 | |
| 7 | 13/7/22 | 15h52 | 16h11 | 37,2 | 37,3 | |
| 8 | 13/7/22 | 17h59 | 18h18 | 36,3 | 37,4 | |
Current usage metrics show cumulative count of Article Views (full-text article views including HTML views, PDF and ePub downloads, according to the available data) and Abstracts Views on Vision4Press platform.
Data correspond to usage on the plateform after 2015. The current usage metrics is available 48-96 hours after online publication and is updated daily on week days.
Initial download of the metrics may take a while.