


Figure 5
Download original image
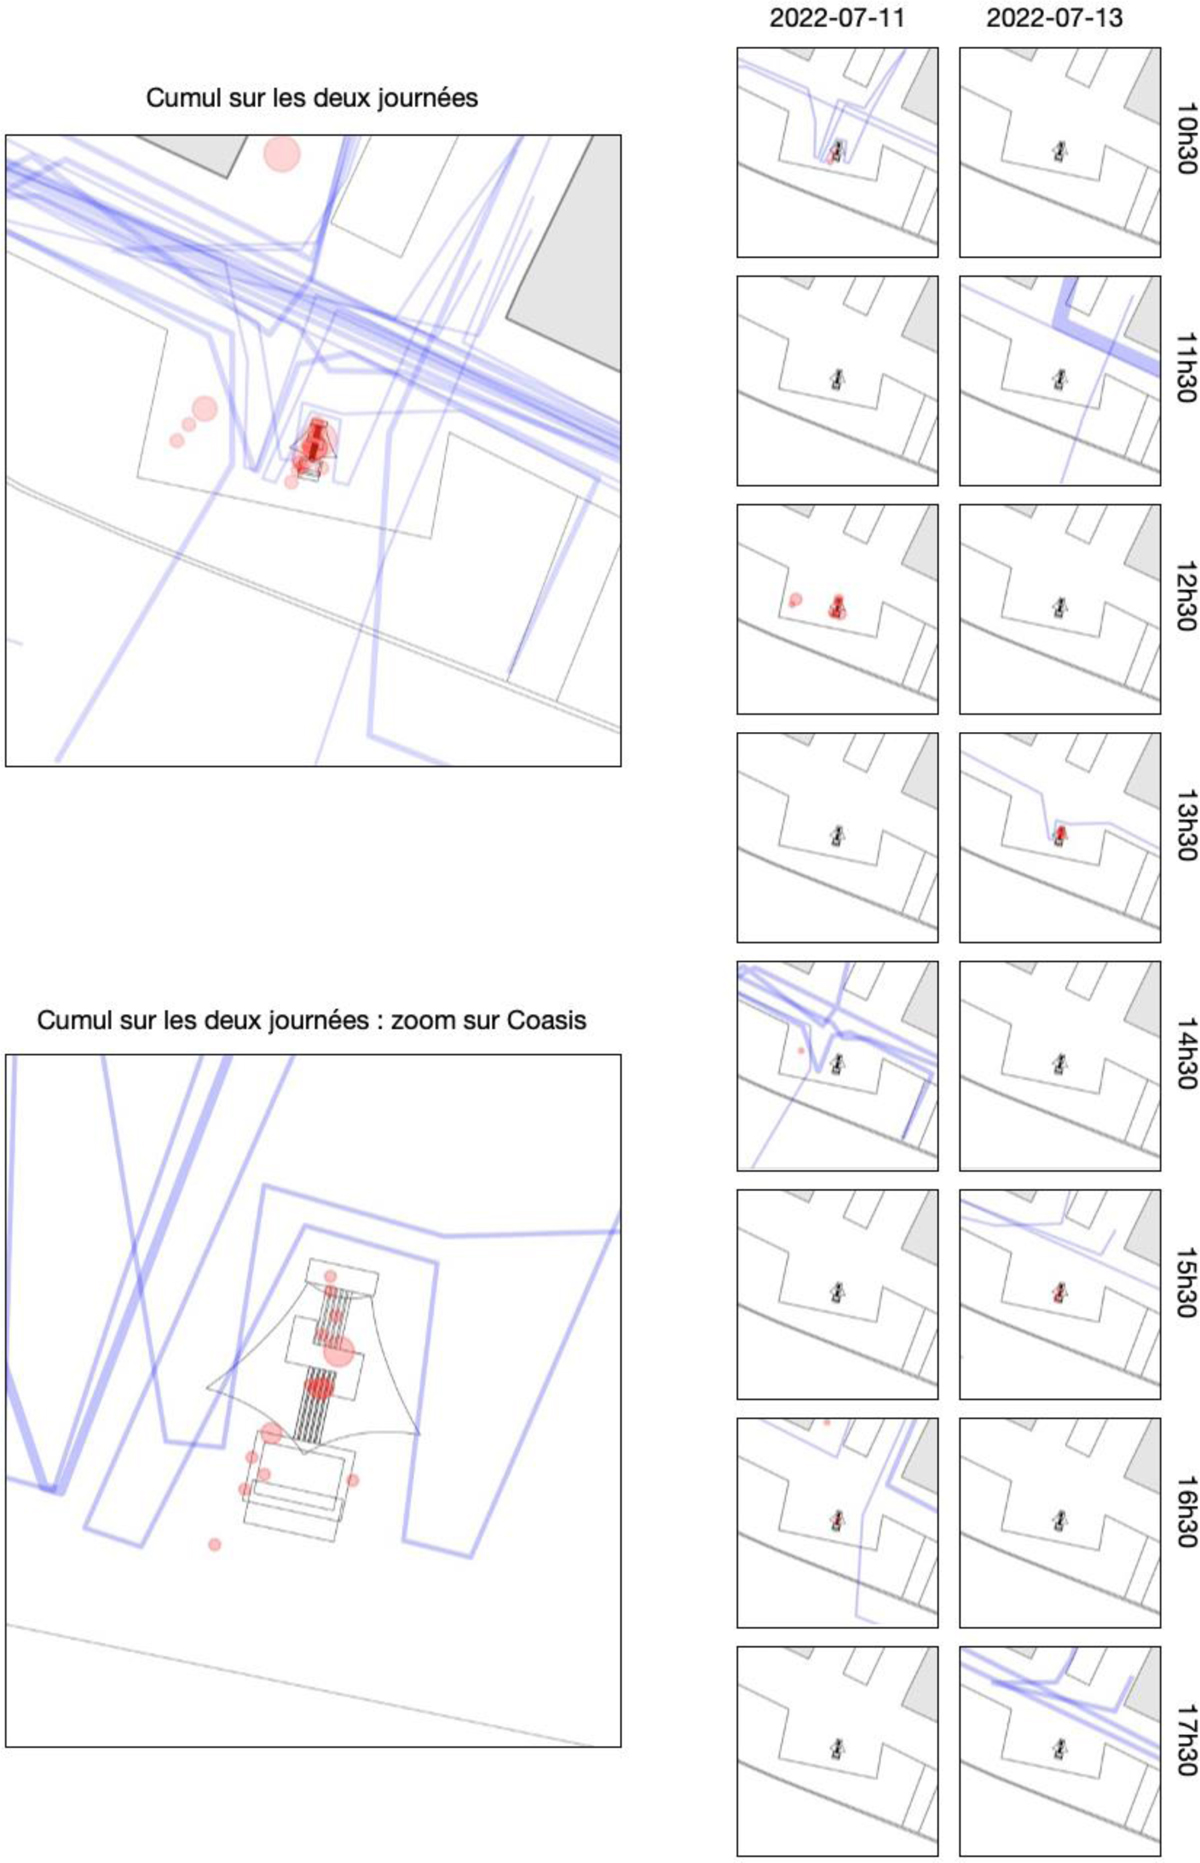
Déplacements (lignes bleues) et arrêts (disques rouges) relevés dans la zone d’étude durant les deux jours d’observation. Représentation par tranche horaire en colonnes à droite et en cumul sur les deux journées, avec un zoom sur Coasis, à gauche. La largeur des lignes et le diamètre des disques sont fonction du nombre de personnes. © I. Requena / AAU-Crenau. Journeys (blue lines) and stops (red discs) recorded in the study area during the two days of observation. Representation by time slot in columns on the right and cumulative over the two days, with a zoom on Coasis, on the left. The width of the lines and the diameter of the discs are a function of the number of people. © I. Requena / AAU-Crenau.
Current usage metrics show cumulative count of Article Views (full-text article views including HTML views, PDF and ePub downloads, according to the available data) and Abstracts Views on Vision4Press platform.
Data correspond to usage on the plateform after 2015. The current usage metrics is available 48-96 hours after online publication and is updated daily on week days.
Initial download of the metrics may take a while.