")
")
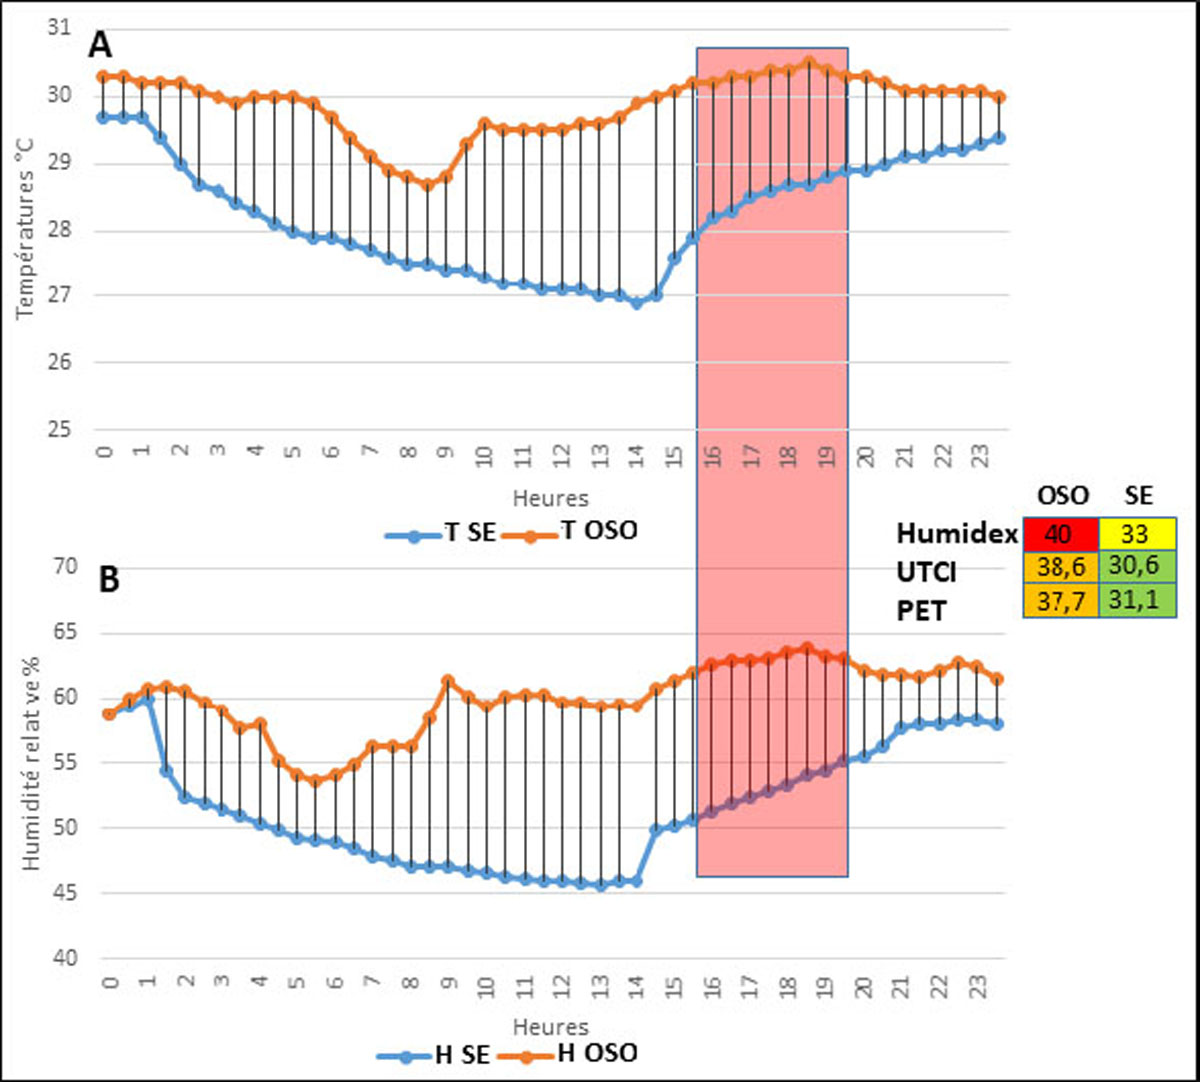
Figure 4
Download original image
Cycle journalier des températures de l’air (T) à l’intérieur et de l’humidité relative (H) dans deux pièces (T1 et T3 ; figure 1 et tableau 1) le 21 août 2024, et indice de confort en fin d’après-midi (données Testo 400). La zone rectangulaire rose représente la période de la journée durant laquelle un maximum d’inconfort a été observé et les 3 indices associés calculés. Les couleurs utilisées indiquent le degré d’intensité de l’inconfort.
Daily cycle of indoor air temperature (T) and relative humidity (H) in two rooms (T1 and T3; figure 1 and table 1) on August 21, 2024, and late afternoon comfort index (Testo 400 data). The pink rectangular area represents the time of day when maximum discomfort was observed, and the following indices are calculated. The colors used indicate the degree of discomfort.
Current usage metrics show cumulative count of Article Views (full-text article views including HTML views, PDF and ePub downloads, according to the available data) and Abstracts Views on Vision4Press platform.
Data correspond to usage on the plateform after 2015. The current usage metrics is available 48-96 hours after online publication and is updated daily on week days.
Initial download of the metrics may take a while.