")
")
Figure 4
Download original image
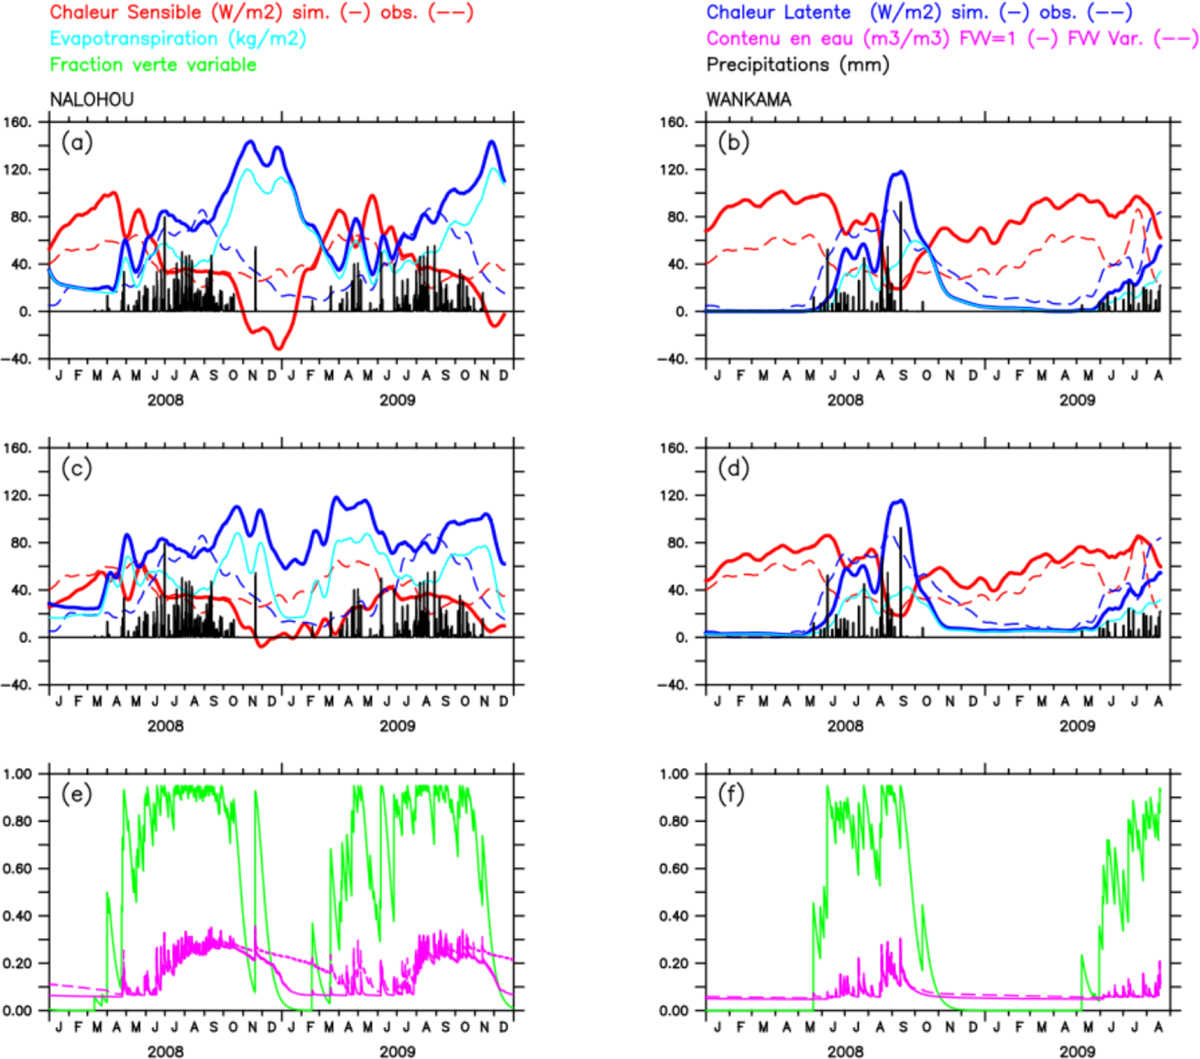
Série temporelle des flux de chaleur sensible (rouge) et latente (bleu) simulés (trait continu) et observés (tireté) pour les stations Nalohou (panel a, c) et Wankama (b et d) avec une fraction verte égale à 1 (a et b) et variable (c et d) ; e et f représentent respectivement les variations de la fraction verte de la végétation (vert) et du contenu en eau (violet) à Nalohou et Wankama (2008-2009). Les précipitations journalières sont représentées par les traits verticaux (en noir). Time series of simulated (solid line) and observed (dashed line) sensible (red) and latent (blue) heat fluxes for the Nalohou (panel a, c) and Wankama (b and d) stations with a green fraction equal to 1 (a and b) and variable (c and d); e and f represent variations in the green fraction of vegetation (green) and water content (violet) respectively at Nalohou and Wankama (2008-2009). Daily rainfall is represented by the vertical lines (in black).
Current usage metrics show cumulative count of Article Views (full-text article views including HTML views, PDF and ePub downloads, according to the available data) and Abstracts Views on Vision4Press platform.
Data correspond to usage on the plateform after 2015. The current usage metrics is available 48-96 hours after online publication and is updated daily on week days.
Initial download of the metrics may take a while.