")
")
Open Access
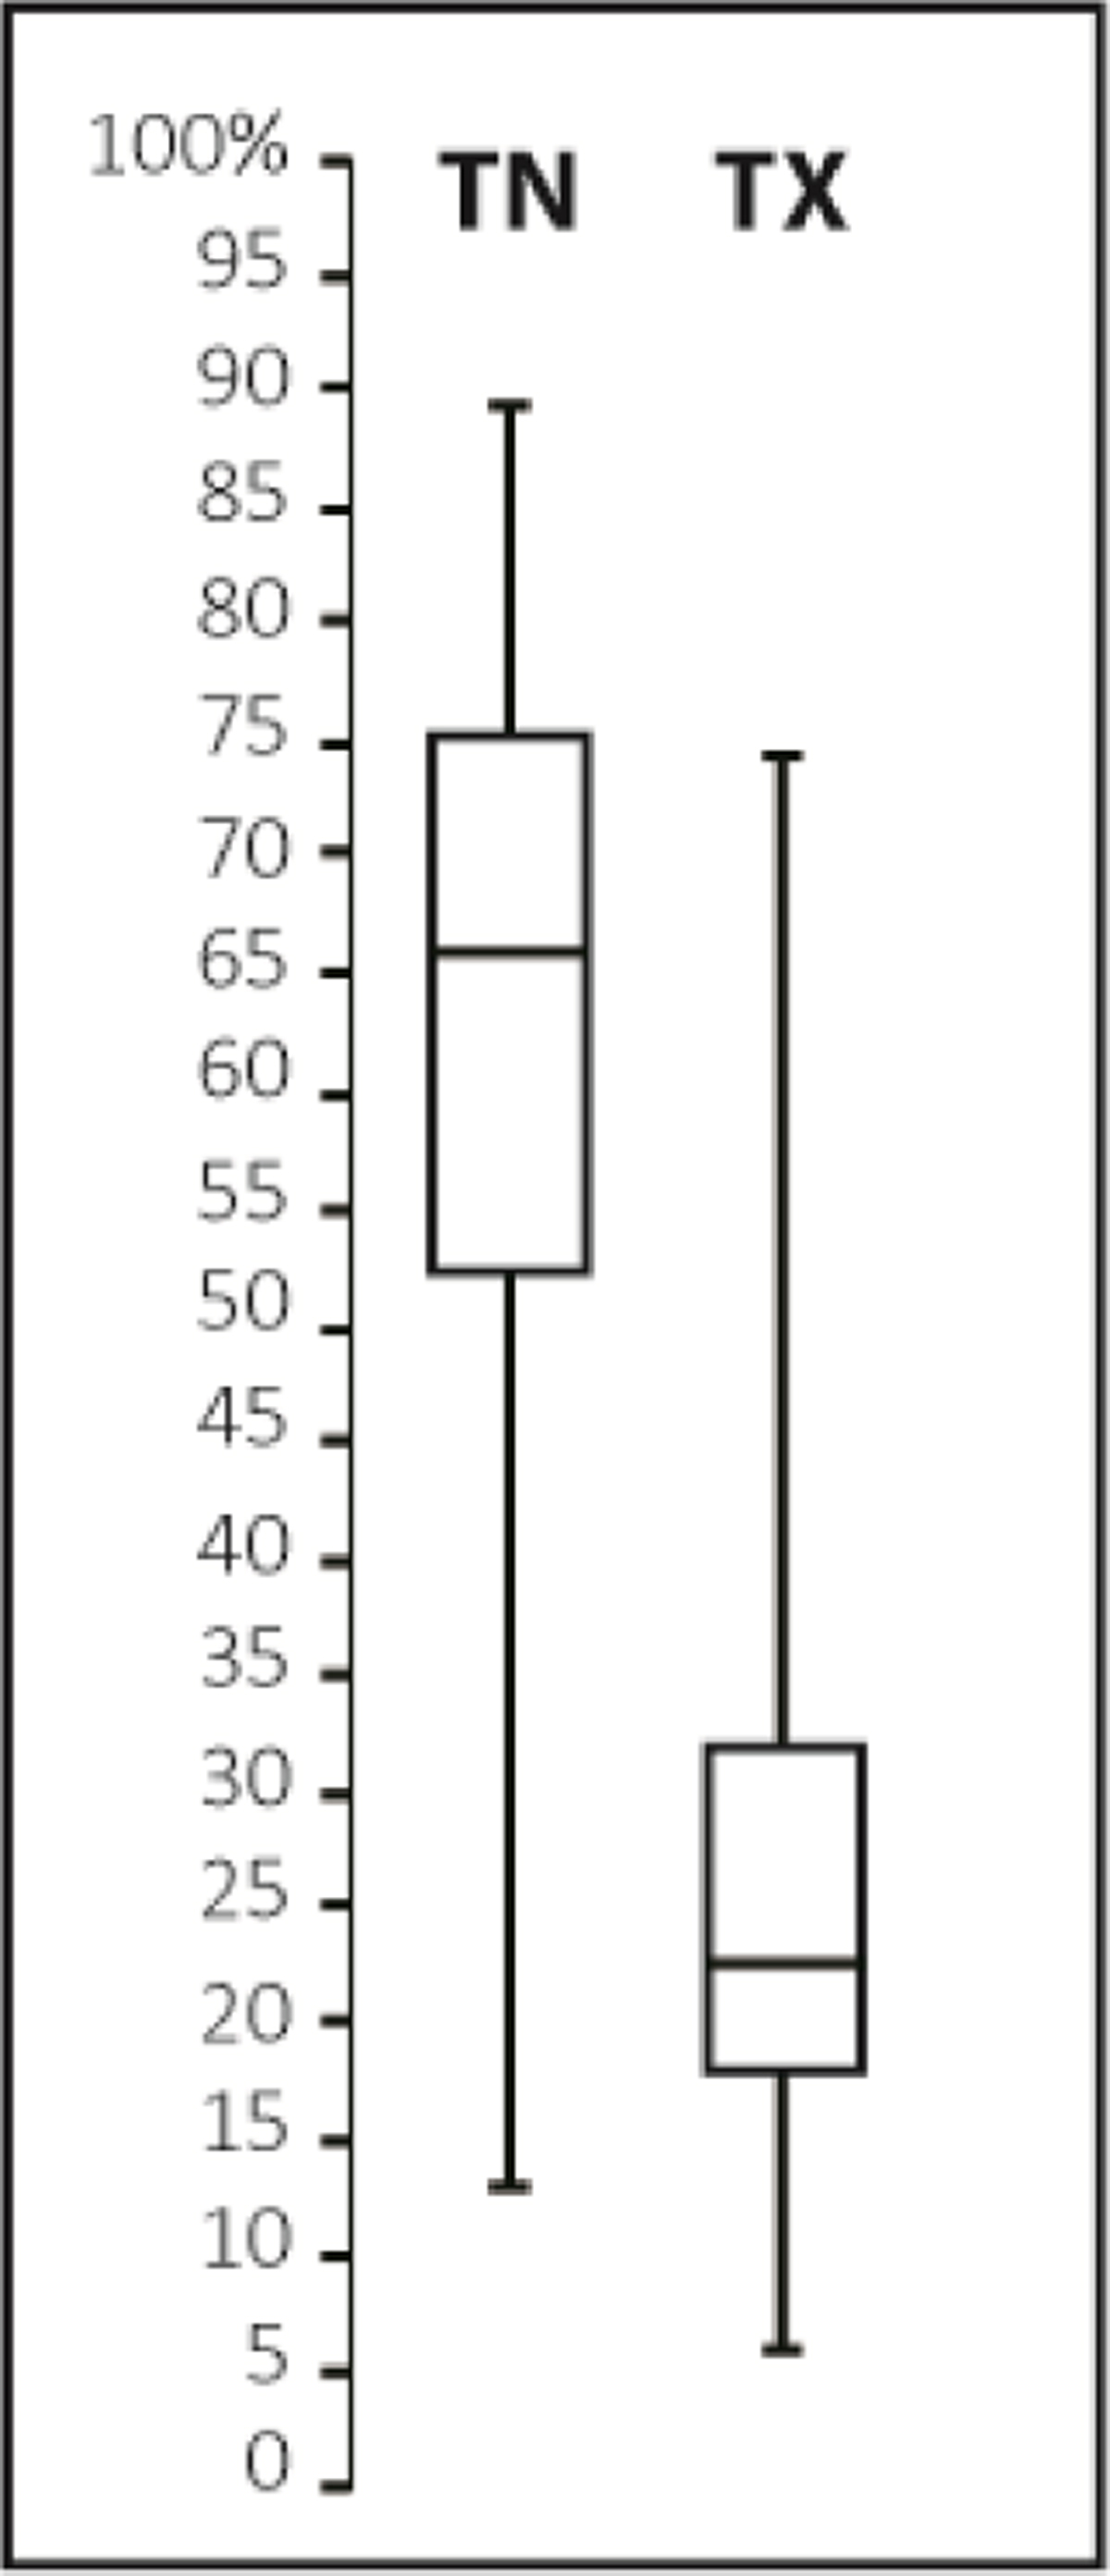
Figure 8
Download original image
Box plot of tn and tx inversion frequency at daily scale (3657 days from 1 January 2008 to 31 December 2017). Boîte à moustaches de la fréquence des inversions tn et tx à l’échelle quotidienne (3657 jours du 1er janvier 2008 au 31 décembre 2017).
Current usage metrics show cumulative count of Article Views (full-text article views including HTML views, PDF and ePub downloads, according to the available data) and Abstracts Views on Vision4Press platform.
Data correspond to usage on the plateform after 2015. The current usage metrics is available 48-96 hours after online publication and is updated daily on week days.
Initial download of the metrics may take a while.