")
")
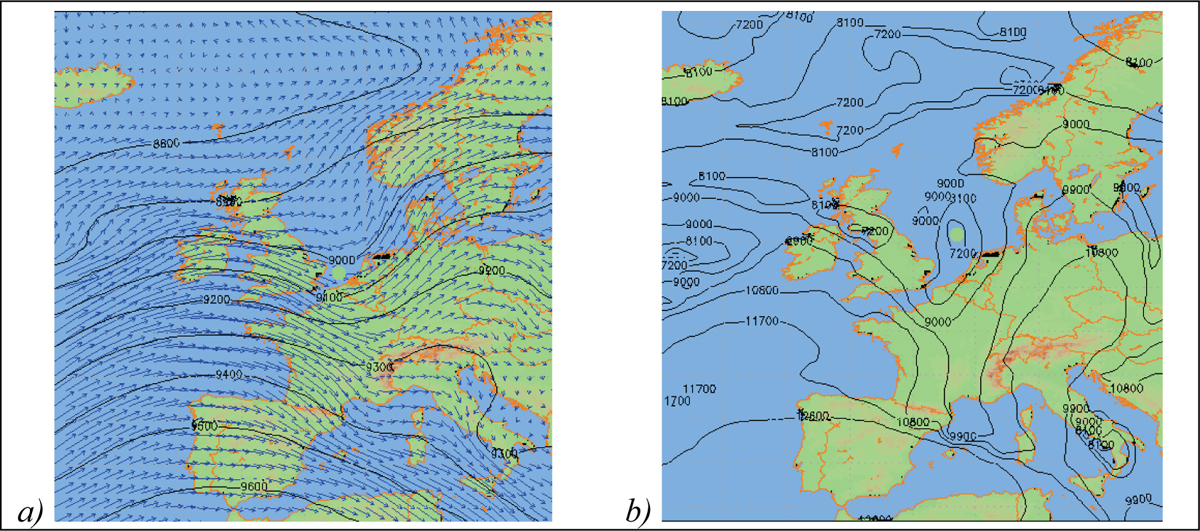
Figure 8
Download original image
Cartes représentant la situation de non-Mistral du 9 mai 2015 à 12 h TU : a) géopotentiel (dam) et vent (m.s-1) sur la surface 300 hPa; b) géopotentiel au niveau 2pvu (dam). Le point vert centre l’anomalie de tropopause. Non-Mistral situation of the 09th of May 2015 at 12h UTC: a) geopotentiel (dam) and wind (m.s-1) at 300hPa level; b) geopotentiel at 2pvu (dam) level. Green circle show the tropopause anomaly.
Current usage metrics show cumulative count of Article Views (full-text article views including HTML views, PDF and ePub downloads, according to the available data) and Abstracts Views on Vision4Press platform.
Data correspond to usage on the plateform after 2015. The current usage metrics is available 48-96 hours after online publication and is updated daily on week days.
Initial download of the metrics may take a while.