")
")
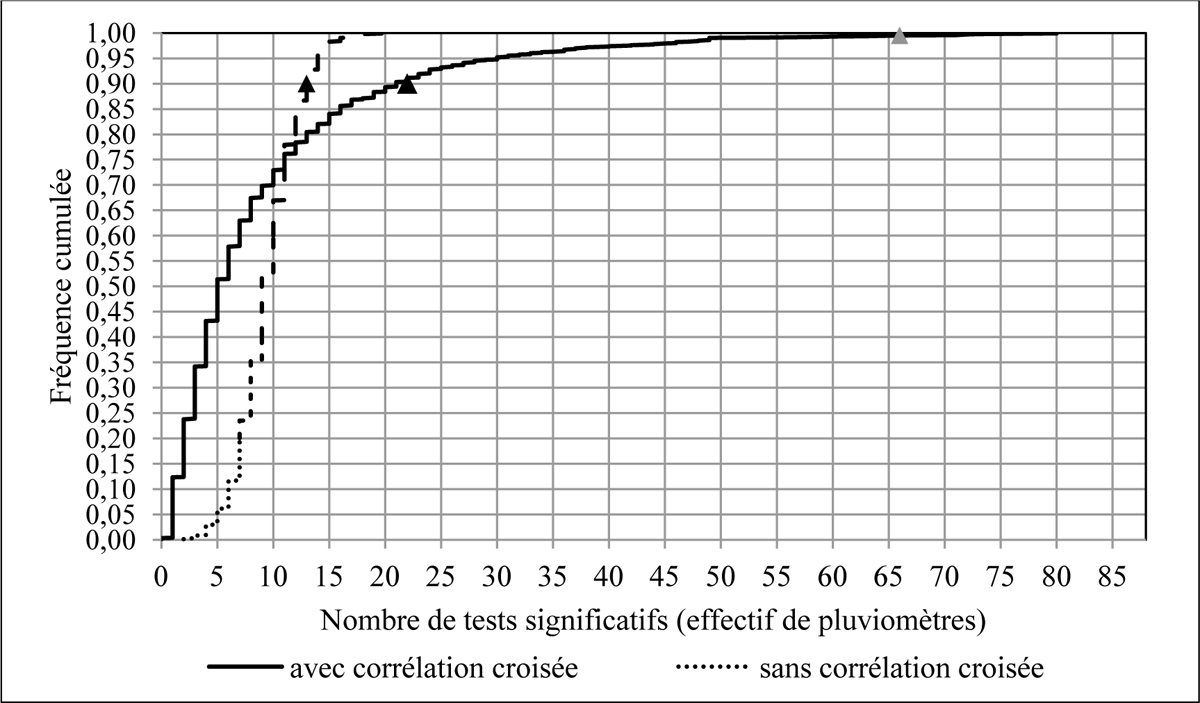
Figure 18
Download original image
Distributions du nombre de tests significatifs (test de Mann-Kendall) pour les 1000 répliques générées par rééchantillonnage avec remise. Indice IJxO (Intensité journalière maximale par flux perturbé d’Ouest). 88 postes pluviométriques, période 1957-2002. Les triangles noirs donnent la valeur critique du nombre de tests pour assurer la significativité locale ou régionale au risque αlocal = αrégional = 0,1 (probabilité au non dépassement de 0,9). Le triangle gris donne le niveau de signification du nombre de tests significatifs dans l’échantillon de données. Bootsrap distribution of the number of locally significant tests (test of Mann-Kendall) for N=1000 samples. MDRw (Maximum Daily Rainfall due to westerly fluxes) index, 88 raingauges, period 1957-2002. Black triangles give the critical number of significant tests for a I-type error of 0.1. Grey triangle shows the p-value of significant tests number in the data sample.
Current usage metrics show cumulative count of Article Views (full-text article views including HTML views, PDF and ePub downloads, according to the available data) and Abstracts Views on Vision4Press platform.
Data correspond to usage on the plateform after 2015. The current usage metrics is available 48-96 hours after online publication and is updated daily on week days.
Initial download of the metrics may take a while.