")
")
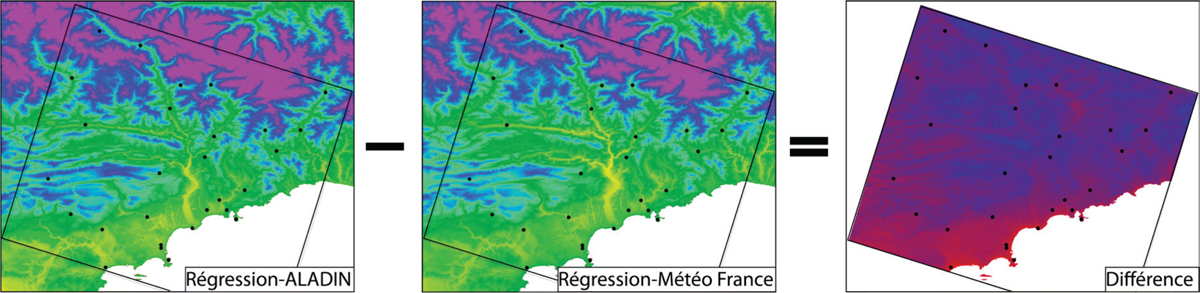
Figure 5
Download original image
Comparaison de la spatialisation des Tx de juin effectuée à partir des deux modèles de régression alimentés par les sorties d’ALADIN (Régression-ALADIN) ou par les mesures de Météo France (Régression-Météo France). Les différences ne sont évaluées que pour l’aire couverte par les stations de mesures de Météo France (points noirs). Comparison of the cartography of June Tx made from both models of regression fed by the outputs of ALADIN (Régression-ALADIN) or by the observed data of Météo France (Régression-Météo France). The differences are only estimated for the area covered by the network of Météo France (black points).
Current usage metrics show cumulative count of Article Views (full-text article views including HTML views, PDF and ePub downloads, according to the available data) and Abstracts Views on Vision4Press platform.
Data correspond to usage on the plateform after 2015. The current usage metrics is available 48-96 hours after online publication and is updated daily on week days.
Initial download of the metrics may take a while.