")
")
Open Access
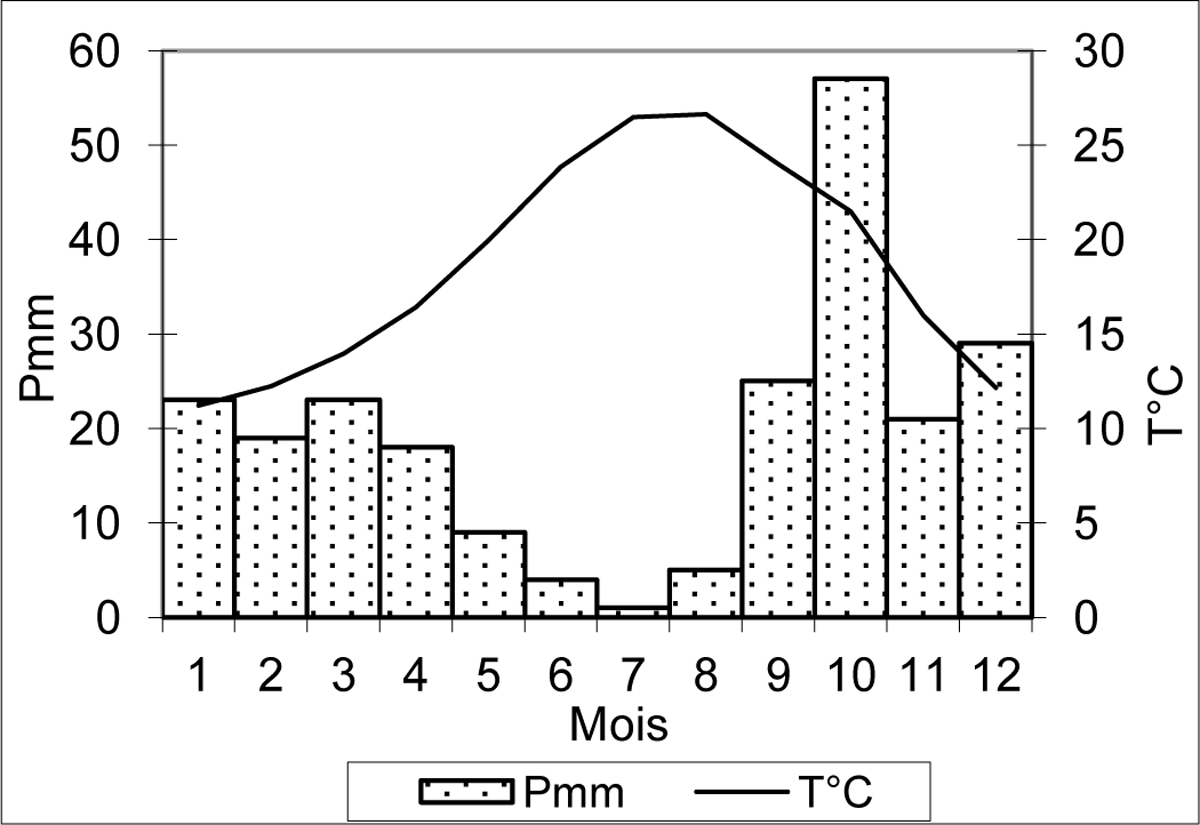
Figure 3
Download original image
Diagramme ombrothermique de Sfax (période 1970-2002, données INM). Diagram showing average monthly thermal and rainfall in Sfax (period 1970-2002, INM data).
Current usage metrics show cumulative count of Article Views (full-text article views including HTML views, PDF and ePub downloads, according to the available data) and Abstracts Views on Vision4Press platform.
Data correspond to usage on the plateform after 2015. The current usage metrics is available 48-96 hours after online publication and is updated daily on week days.
Initial download of the metrics may take a while.