")
")
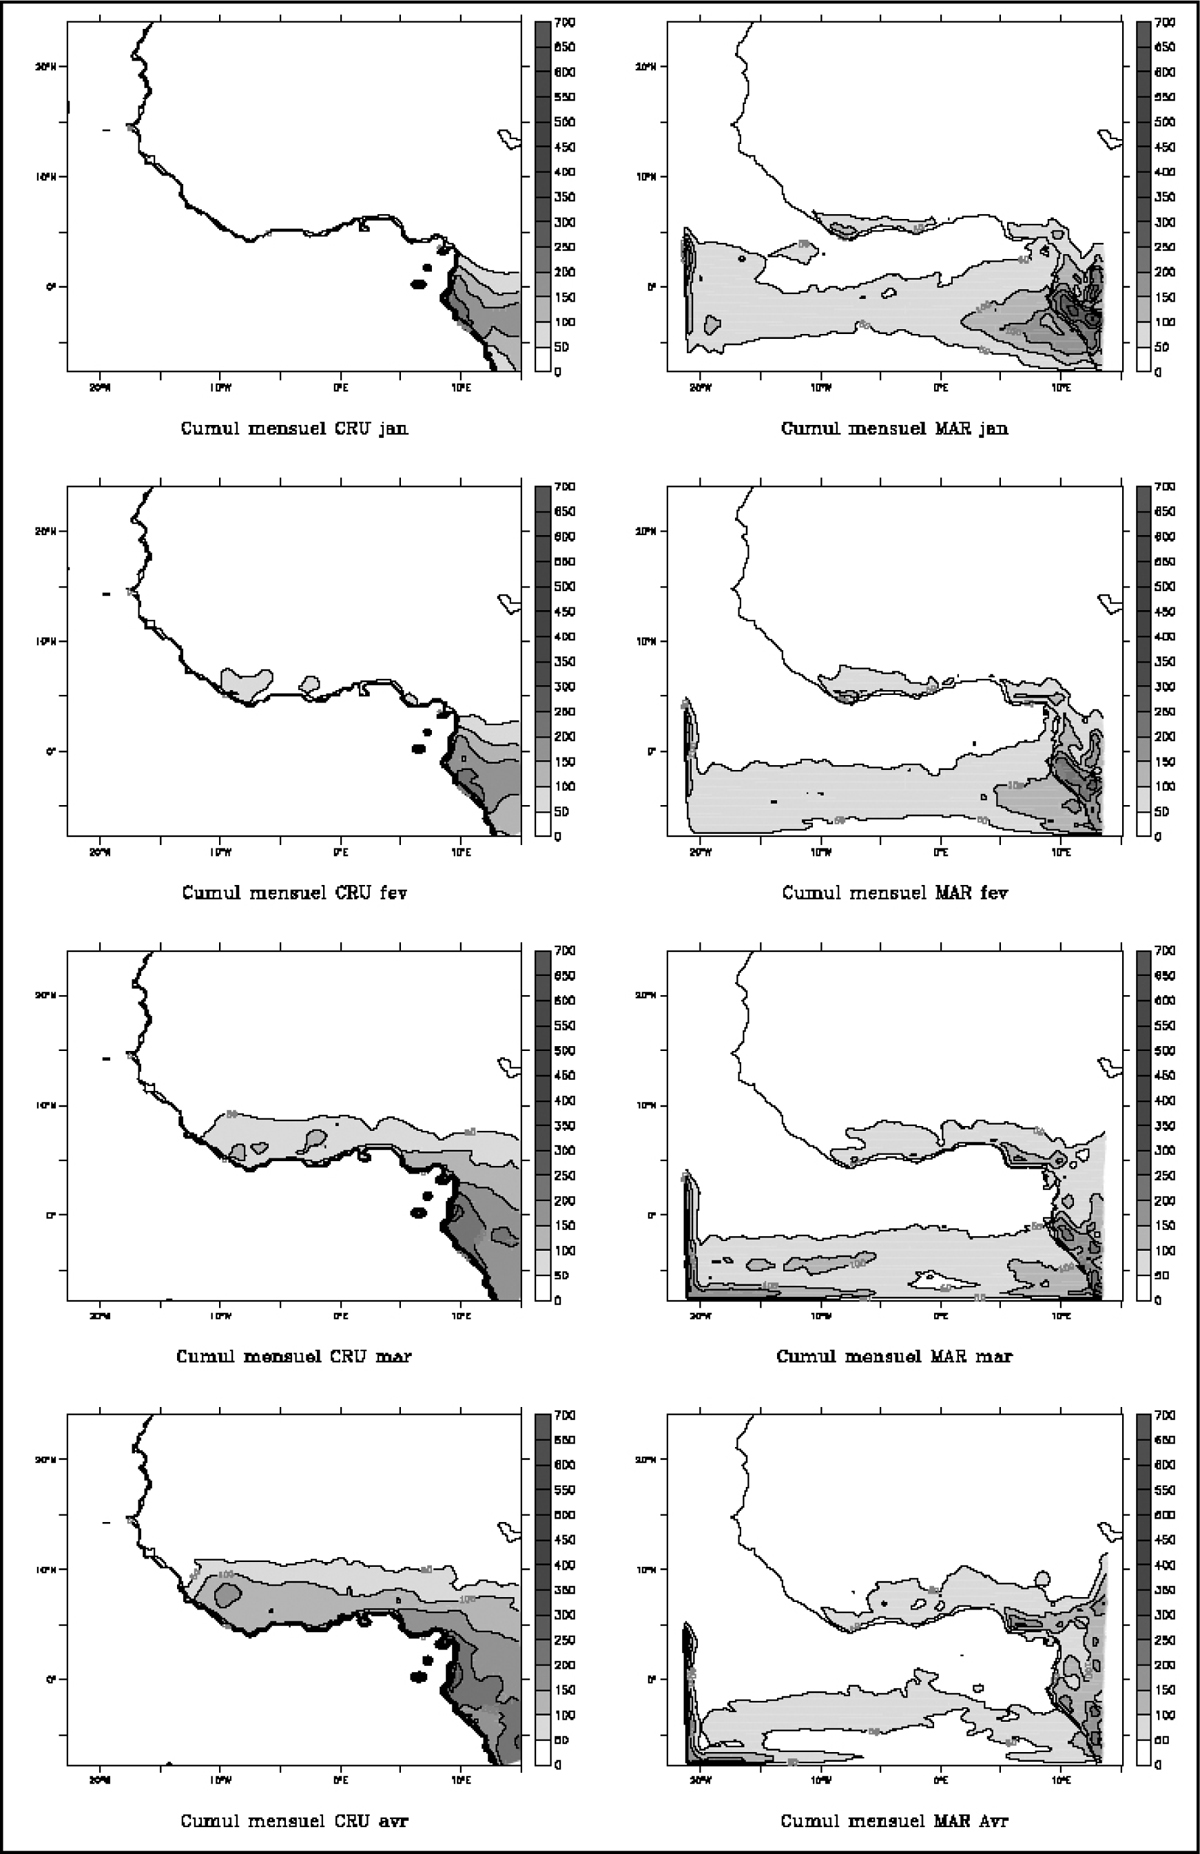
Figure 3
Download original image
Cumul mensuel moyen des précipitations (en mm) calculé sur la période 1983-1992 pour les données d’observation du CRU (cartes de gauche) et la simulation MAR (cartes de droite) pour les mois de janvier à avril. Average monthly rainfall amount (in mm) calculated over the period 1983-1992 for the CRU data (left maps) and the simulation MAR (right maps) for January to April.
Current usage metrics show cumulative count of Article Views (full-text article views including HTML views, PDF and ePub downloads, according to the available data) and Abstracts Views on Vision4Press platform.
Data correspond to usage on the plateform after 2015. The current usage metrics is available 48-96 hours after online publication and is updated daily on week days.
Initial download of the metrics may take a while.