")
")
Figure 4
Download original image
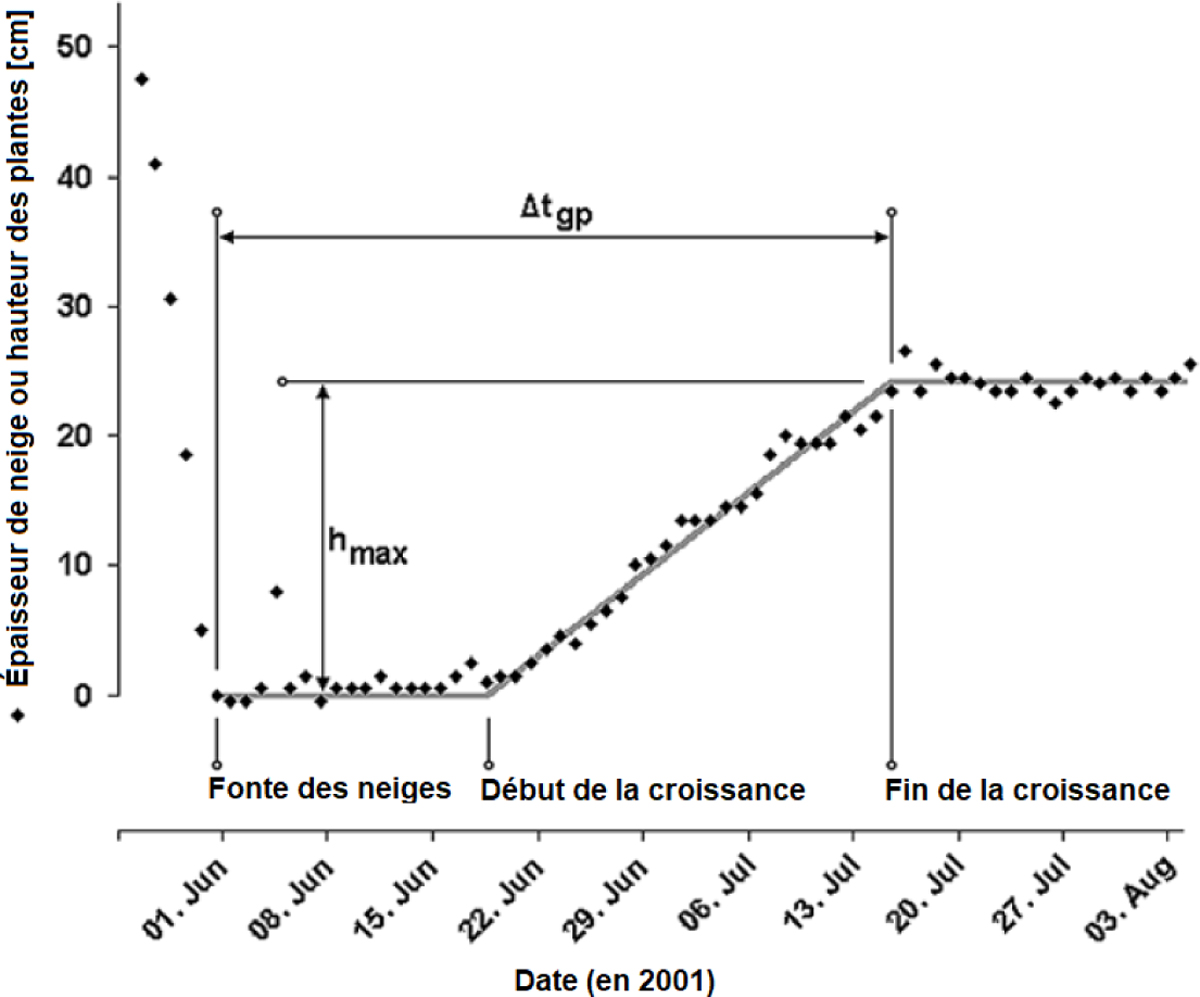
Données issues d’un capteur ultrasonique (SR50), illustrant la fonte des neiges puis le démarrage de la croissance de la végétation alpine à la fin du printemps sur le site de Tujetsch en Suisse (2270 m d’altitude). La ligne grise représente l’ajustement linéaire effectué sur ces données, afin de déterminer un indice de croissance pour les plantes. ∆tgp matérialise la période de croissance et hmax la hauteur maximale de la végétation (adapté de Jonas et al., 2008a). Data from an ultrasonic sensor (SR50), showing the snowmelt and the beginning of alpine vegetation growth at the end of spring (Tujetsch, Switzerland, 2270 m asl). The gray line represent the linear fit used to determine a plant-growth indice. ∆tgp denotes the growth period and hmax the maximum vegetation height (adapted from Jonas et al., 2008a).
Current usage metrics show cumulative count of Article Views (full-text article views including HTML views, PDF and ePub downloads, according to the available data) and Abstracts Views on Vision4Press platform.
Data correspond to usage on the plateform after 2015. The current usage metrics is available 48-96 hours after online publication and is updated daily on week days.
Initial download of the metrics may take a while.