")
")
Open Access
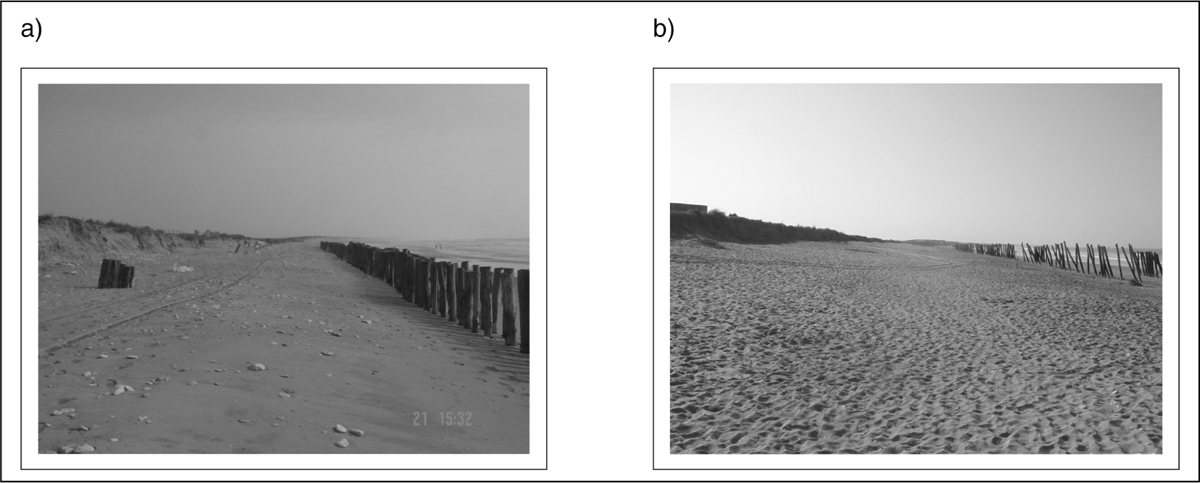
Figure 5
Download original image
Illustration de l’échec de l’aménagement avec la situation en février 2003 (a) et en avril 2007(b). Illustration of the failure of the device with a) Situation in February 2003 and b) Situation in April 2007.
Current usage metrics show cumulative count of Article Views (full-text article views including HTML views, PDF and ePub downloads, according to the available data) and Abstracts Views on Vision4Press platform.
Data correspond to usage on the plateform after 2015. The current usage metrics is available 48-96 hours after online publication and is updated daily on week days.
Initial download of the metrics may take a while.