")
")
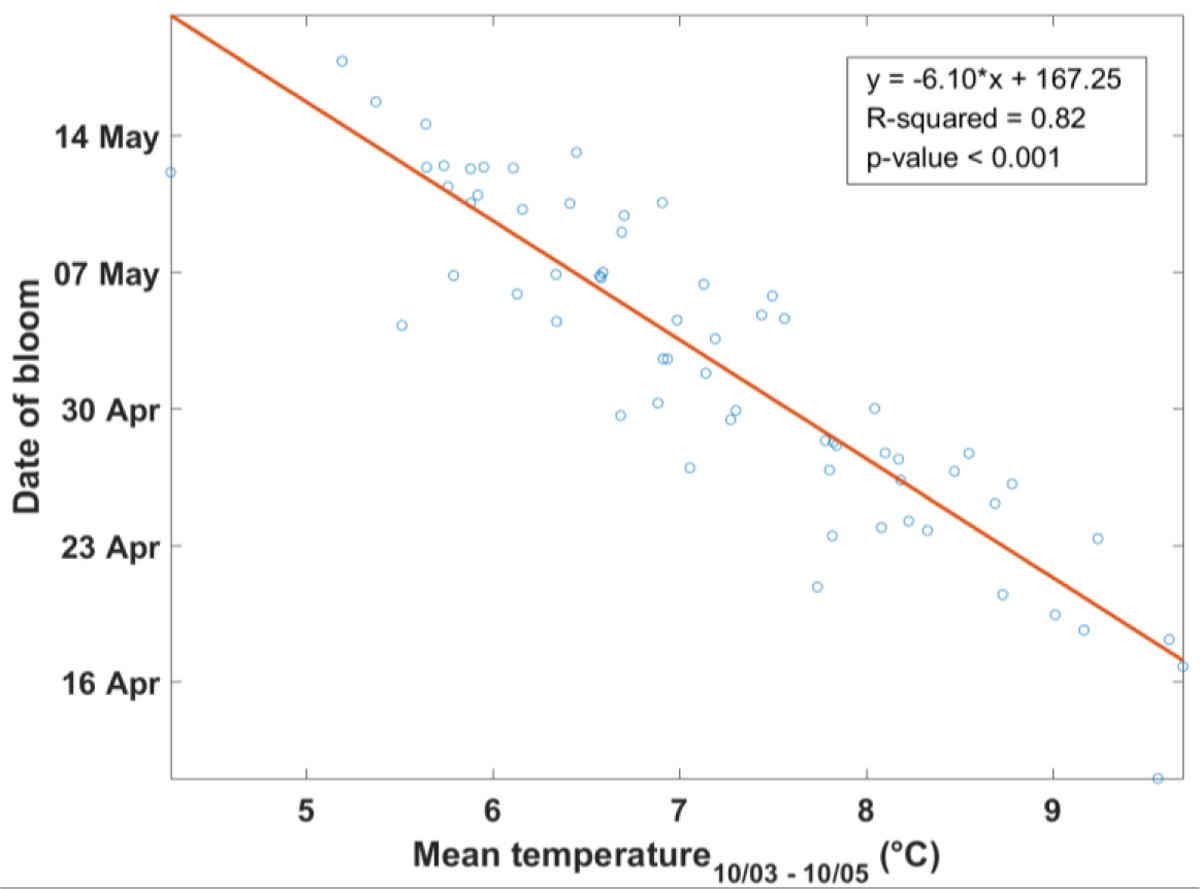
Figure 7
Download original image
Relation between bloom onset dates averaged over Germany and mean temperature in the period between 10th March and 10th May (best one-predictor model). The chosen temperature variable explains 82% of the variance in a linear regression. The points represent the years 1951 to 2014. Relation entre le début moyen de la floraison en Allemagne et la température moyenne entre le 10 mars et le 10 mai (meilleur modèle avec un prédicteur). La variable de température choisie explique 82% de la variance dans une régression linéaire. Les points représentent les années 1951 à 2014.
Current usage metrics show cumulative count of Article Views (full-text article views including HTML views, PDF and ePub downloads, according to the available data) and Abstracts Views on Vision4Press platform.
Data correspond to usage on the plateform after 2015. The current usage metrics is available 48-96 hours after online publication and is updated daily on week days.
Initial download of the metrics may take a while.