")
")
Open Access
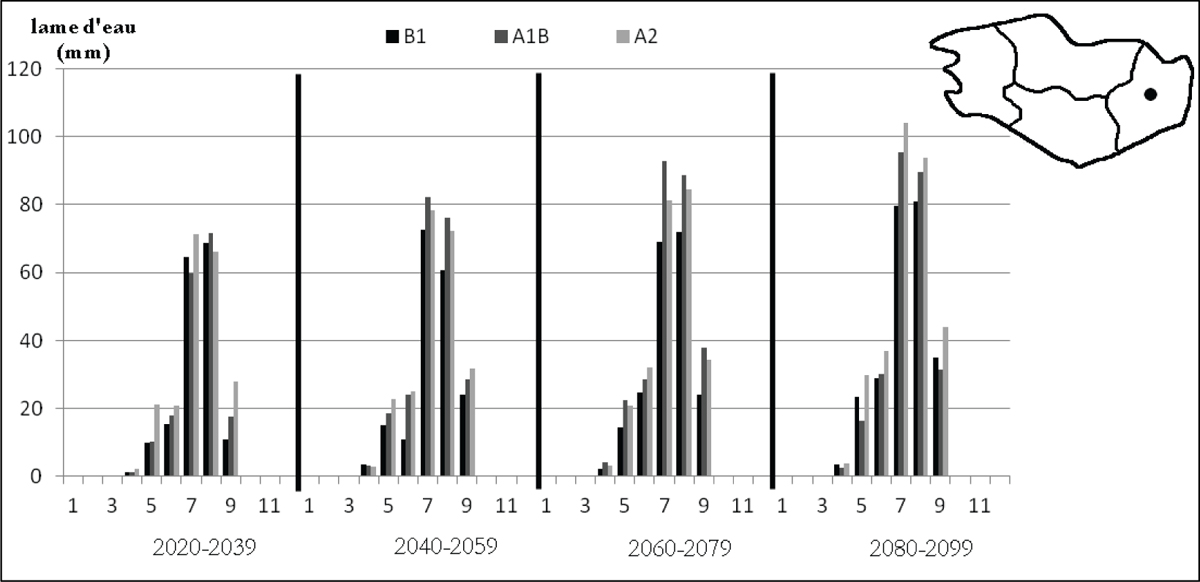
Figure 4
Download original image
Evolution mensuelle du déficit d’évaporation selon 3 scénarios pour 4 périodes du 21ème siècle pour un point de grille situé en Ille-et-Vilaine. Monthly evolution of evaporation deficit according to 3 scenarios and for 4 periods of 21st century for a gridpoint in Ille-et-Vilaine.
Current usage metrics show cumulative count of Article Views (full-text article views including HTML views, PDF and ePub downloads, according to the available data) and Abstracts Views on Vision4Press platform.
Data correspond to usage on the plateform after 2015. The current usage metrics is available 48-96 hours after online publication and is updated daily on week days.
Initial download of the metrics may take a while.