")
")
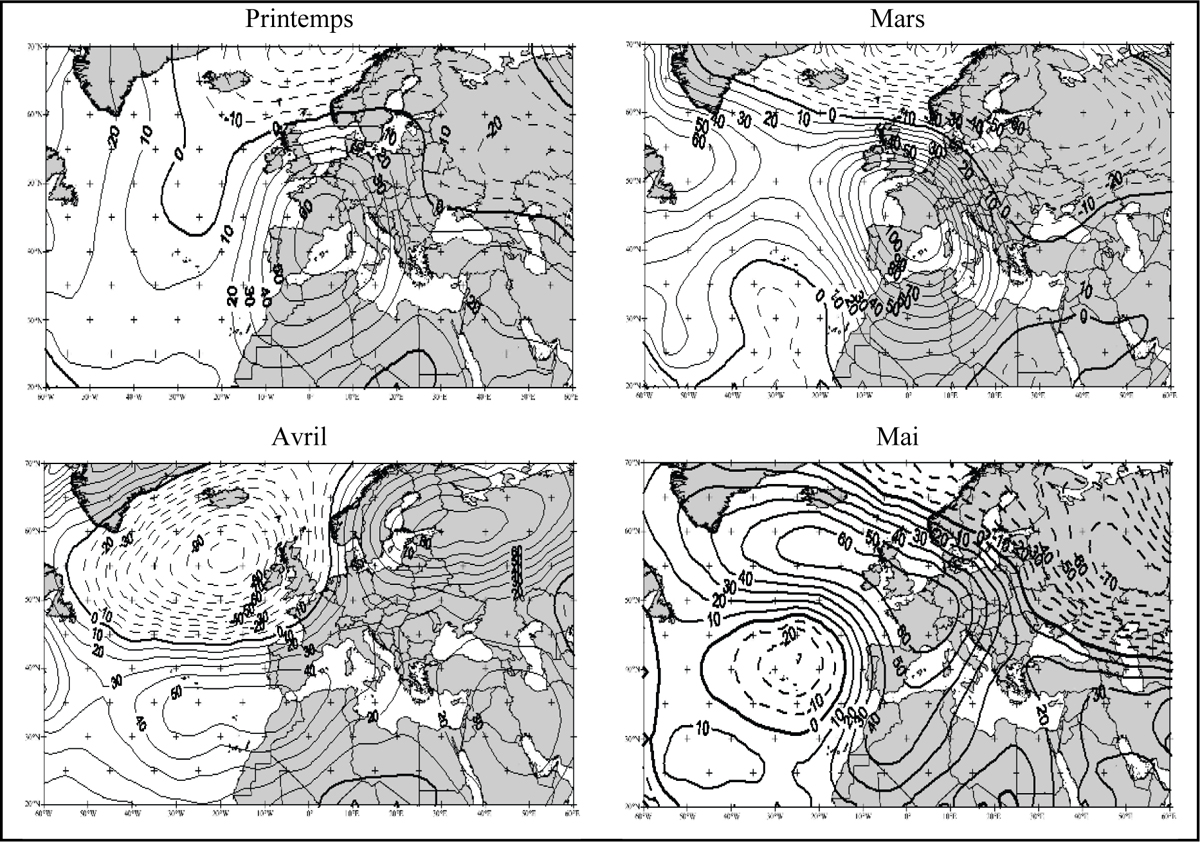
Figure 15
Download original image
Tendance moyenne (en mgp) du haut géopotentiel 500 hPa au printemps (mars-avril-mai) et aux mois de mars, avril et mai sur la période 1971-2002; ligne continue : tendance positive; ligne discontinue : tendance négative (d’après les données de rénalyses NCEP/NCAR). Average trend (in PGM) of 500 hPa geopotential height in the spring (March-April-May) and for March, April and May over the 1971-2002 period; solid line: positive trend, dashed line: negative trend (based on NCEP/NCAR reanalyses).
Current usage metrics show cumulative count of Article Views (full-text article views including HTML views, PDF and ePub downloads, according to the available data) and Abstracts Views on Vision4Press platform.
Data correspond to usage on the plateform after 2015. The current usage metrics is available 48-96 hours after online publication and is updated daily on week days.
Initial download of the metrics may take a while.