")
")
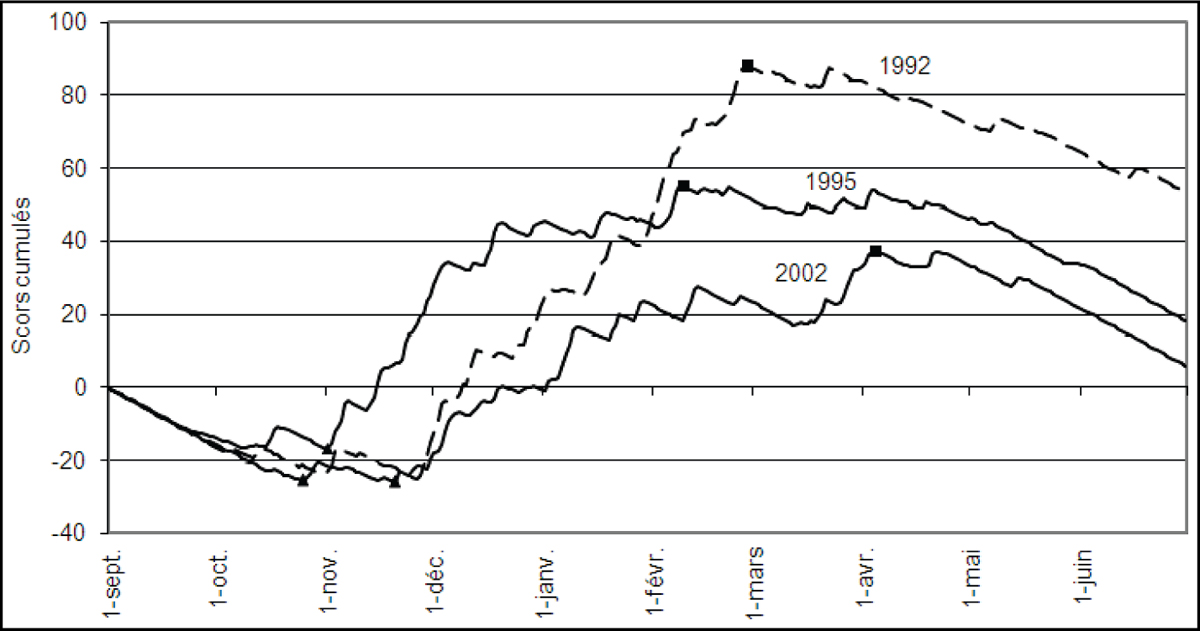
Figure 11
Download original image
Comparaison des scores cumulés de la première composante entre les années 1992, 1995 et 2002 au Proche-Orient sur la période allant du 1er septembre au 30 juin (les triangles représentent les dates de début de la saison des pluies, les carrés représentent les dates de sa fin). Comparison of cumulative scores of the first component between the years 1992, 1995 and 2002 in the Middle East on the period from September 1 to June 30 (the triangles represent the dates of the beginning of the rainy season, the squares represent end dates).
Current usage metrics show cumulative count of Article Views (full-text article views including HTML views, PDF and ePub downloads, according to the available data) and Abstracts Views on Vision4Press platform.
Data correspond to usage on the plateform after 2015. The current usage metrics is available 48-96 hours after online publication and is updated daily on week days.
Initial download of the metrics may take a while.