")
")
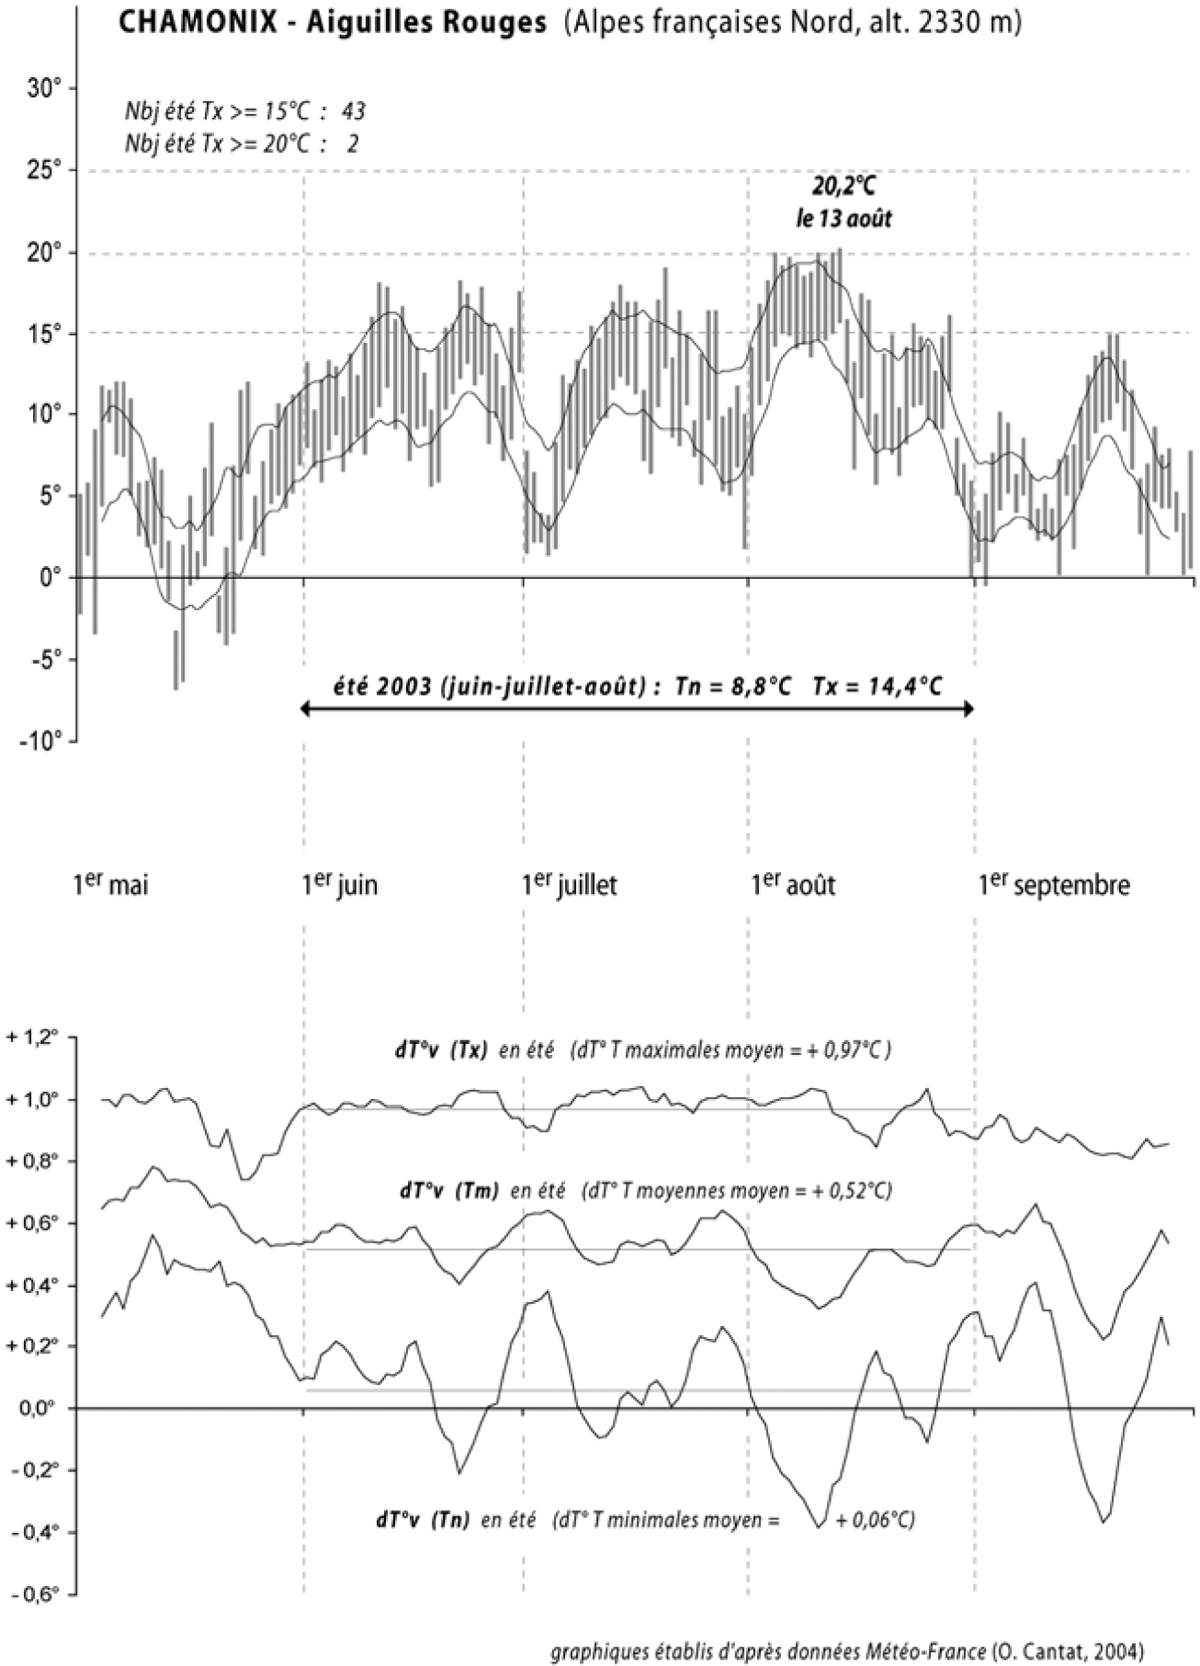
Figure 6a
Download original image
a Températures minimales et maximales à Chamonix Aiguilles Rouges entre mai et septembre 2003 (températures ‘vraies’ en bâton et moyennes mobiles glissantes d’ordre 7 en courbe). Minimal and maximal temperatures at Chamonix Aiguilles Rouges between May and October 2003.
Figure 6b: Gradient thermique vertical quotidien (dT°v) à Chamonix entre la vallée (1042 m alt.) et les versants (2330 m alt.) (moyennes mobiles glissantes d’ordre 7 en courbe). Vertical temperature gradient (dT°v) in Chamonix from the valley (1042 m) to the high slopes (c. 2230 m).
Current usage metrics show cumulative count of Article Views (full-text article views including HTML views, PDF and ePub downloads, according to the available data) and Abstracts Views on Vision4Press platform.
Data correspond to usage on the plateform after 2015. The current usage metrics is available 48-96 hours after online publication and is updated daily on week days.
Initial download of the metrics may take a while.