")
")
Figure 2
Download original image
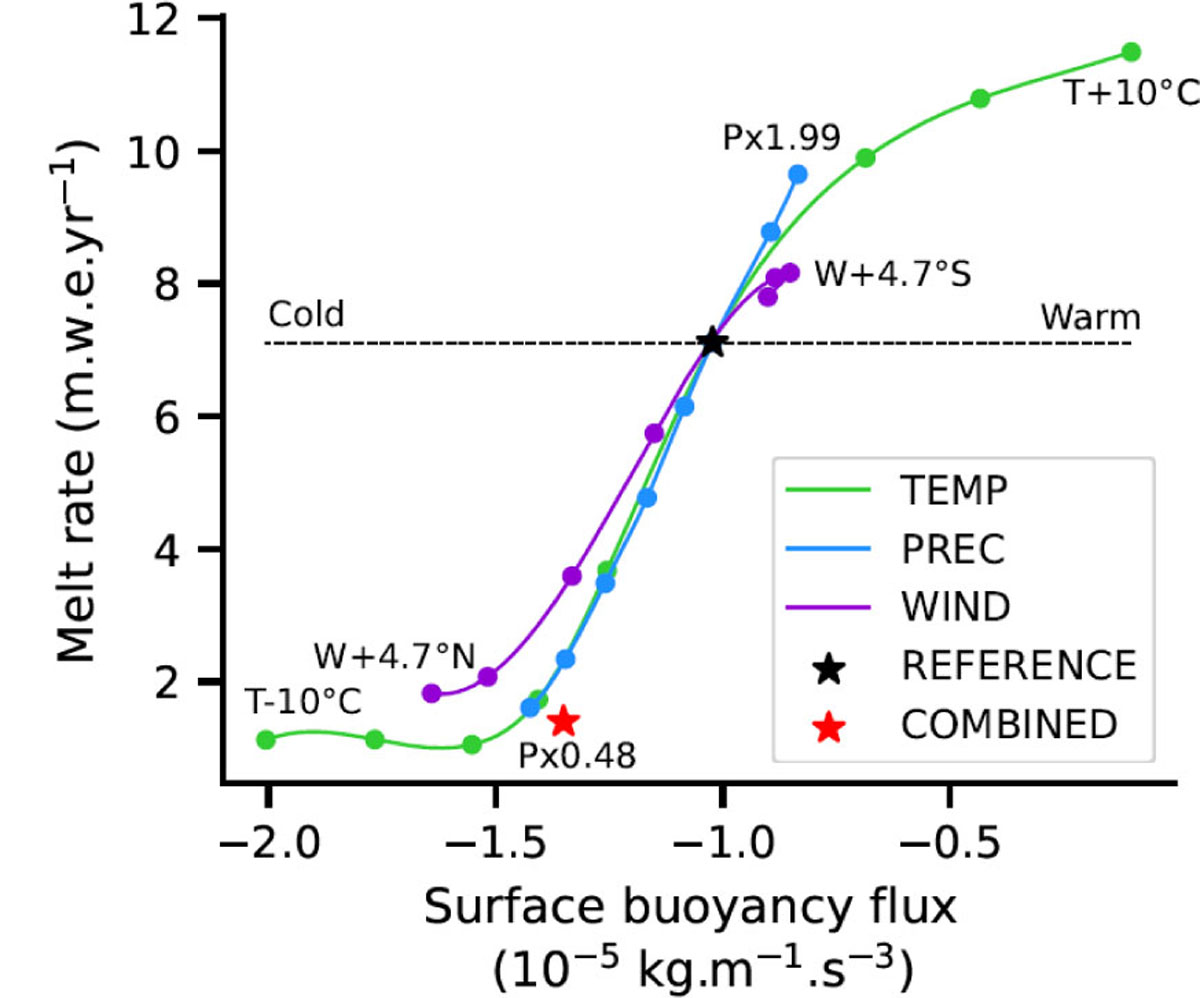
Taux de fonte moyen des plateformes de glace en fonction du flux moyen de flottabilité en surface au-dessus du plateau continental de la mer d’Amundsen sur la période 1988-2018. Le flux de flottabilité représente l’effet des échanges de chaleur et d’eau douce entre l’océan, la banquise et l’atmosphère sur la densité de l’océan de surface. Les courbes verte, bleue et violette correspondent respectivement aux perturbations de la température de l’air, des précipitations et des vents. Chaque point représente une perturbation spécifique. L’étoile noire représente le cas de référence (climat actuel). L’étoile rouge correspond au climat actuel abaissé de 0,5°C en combinant toutes les perturbations atmosphériques. Figure issue de Caillet et al. (2023).
Mean ice-shelf melt rate as a function of mean surface buoyancy flux over the Amundsen Sea continental shelf for the period 1988–2018. Buoyancy flux reflects the effect of heat and freshwater exchanges between the ocean, sea ice, and atmosphere on surface ocean density. The green, blue, and purple curves correspond to perturbations in air temperature, precipitation, and wind, respectively. Each point represents a specific perturbation. The black star represents the reference case (present-day climate). The red star corresponds to the present-day climate cooled by 0.5°C by combining all atmospheric perturbations. Figure is from Caillet et al. (2023).
Current usage metrics show cumulative count of Article Views (full-text article views including HTML views, PDF and ePub downloads, according to the available data) and Abstracts Views on Vision4Press platform.
Data correspond to usage on the plateform after 2015. The current usage metrics is available 48-96 hours after online publication and is updated daily on week days.
Initial download of the metrics may take a while.