")
")
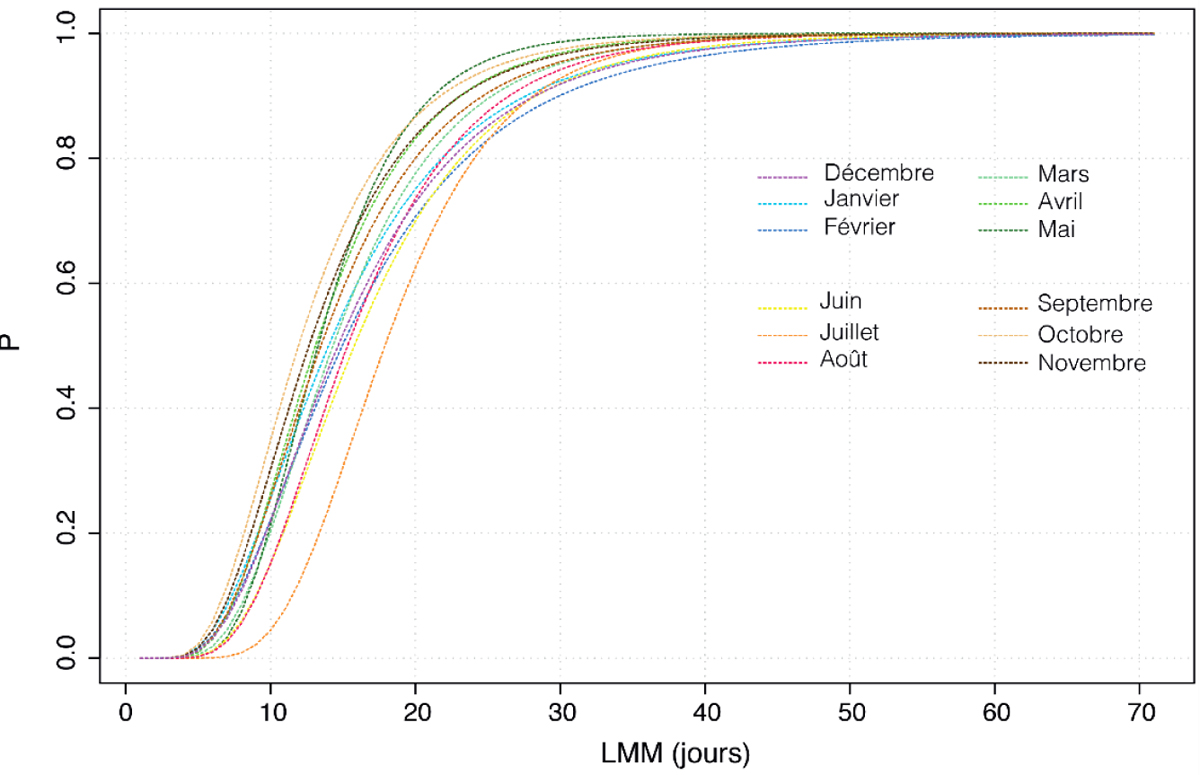
Figure 4
Download original image
Fonctions de répartitions des longueurs maximales mensuelles (LMM) du sous-échantillon utilisé pour décrire la variabilité temporelle entre 1900 et 2019 des sécheresses atmosphériques (seuil de 1 mm). Une fonction de répartition est représentée pour chaque mois de l’année. Distribution functions of the maximum monthly lengths (MML) of the subsample used to describe the temporal variability between 1900 and 2019 of atmospheric droughts (1mm threshold). One distribution function is shown for each month of the year.
Current usage metrics show cumulative count of Article Views (full-text article views including HTML views, PDF and ePub downloads, according to the available data) and Abstracts Views on Vision4Press platform.
Data correspond to usage on the plateform after 2015. The current usage metrics is available 48-96 hours after online publication and is updated daily on week days.
Initial download of the metrics may take a while.