")
")
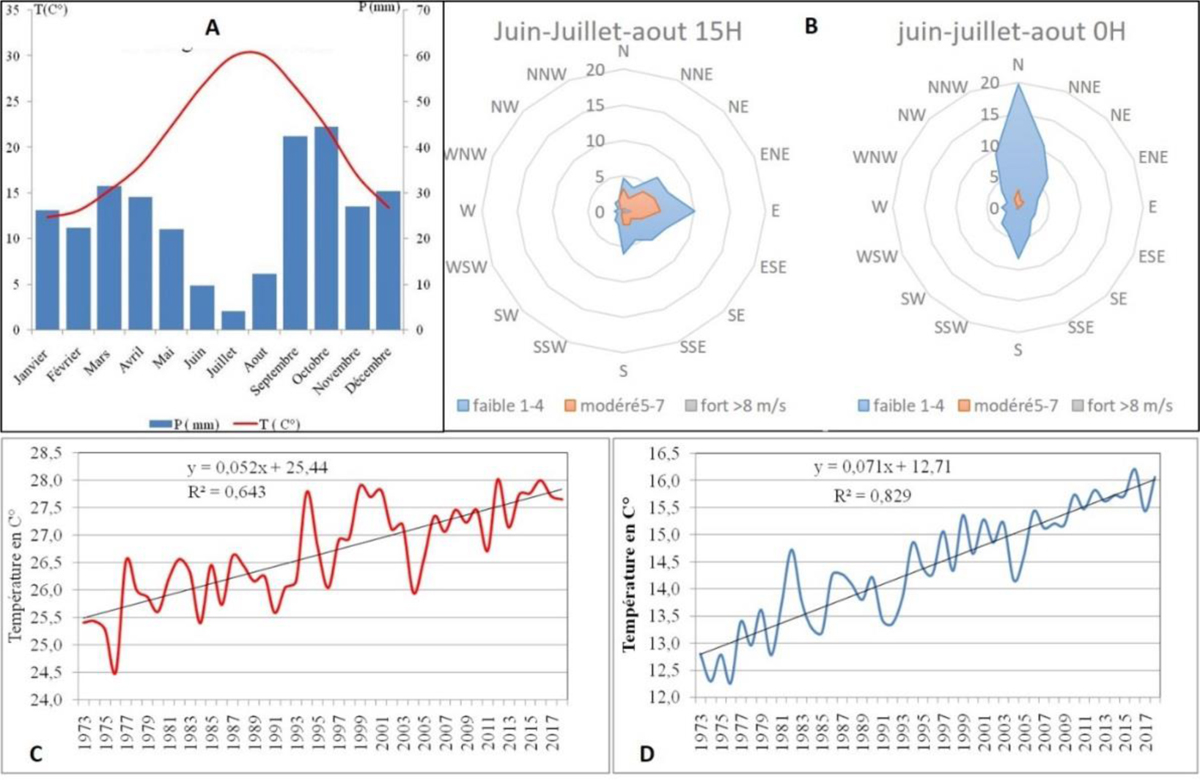
Figure 3
Download original image
Diagramme ombrothermique (A), rose moyenne du vent l’été à 0h et 15h (B), tendance des températures maximales (C) et minimales (D) à Kairouan de 1973 à 2019 (données : Institut National de la Météorologie). Ombrothermal diagram (A), average windmill in summer at midnight and 3 p.m. (B), maximum (C) and minimum (D) temperatures trend in Kairouan from 1973 to 2019 (data from National Institute of Meteorology).
Current usage metrics show cumulative count of Article Views (full-text article views including HTML views, PDF and ePub downloads, according to the available data) and Abstracts Views on Vision4Press platform.
Data correspond to usage on the plateform after 2015. The current usage metrics is available 48-96 hours after online publication and is updated daily on week days.
Initial download of the metrics may take a while.