")
")
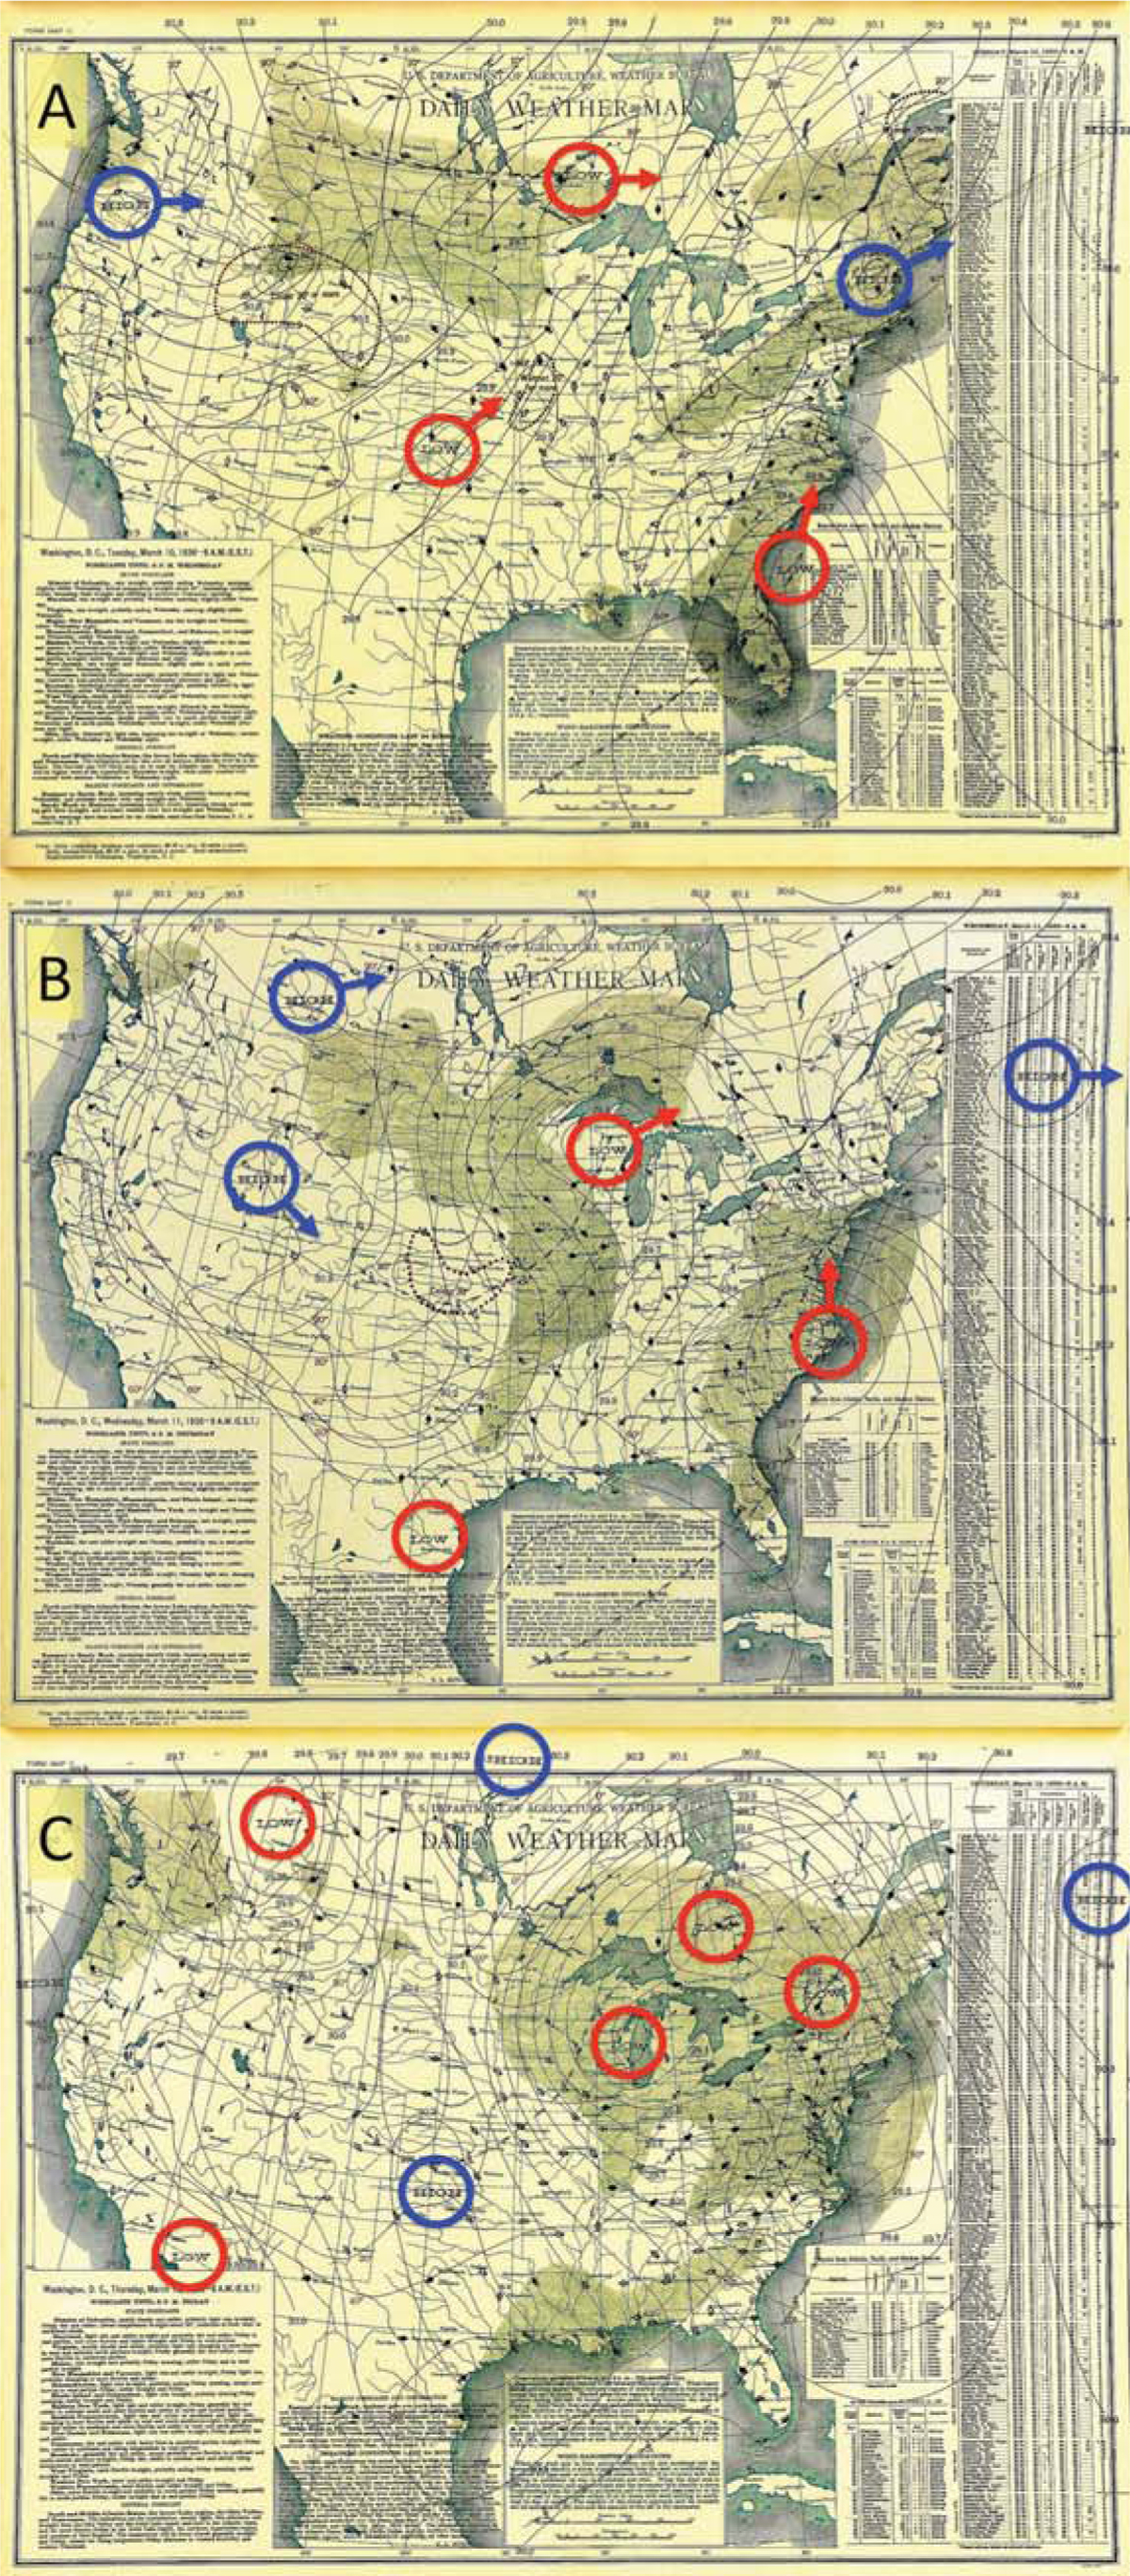
Figure 17
Download original image
Cartes synoptiques des 10 (A), 11 (B) et 12 (C) mars 1936. La crise météorologique du 12 mars 1936 résulte de la fusion de deux dépressions (cercles rouges), l’une provenant de la région des Grands-Lacs et l’autre de la côte atlantique de la Floride. Les taches ombrées désignent les zones de précipitation. Les cercles bleus localisent les hautes pressions. Les flèches indiquent la trajectoire. Source : NOAA Central Library Data Imaging Project. Synoptic maps of 10 (A), 11 (B) and 12 (C) March 1936. The meteorological crisis of 12 March 1936 resulted from the encounter of two depressions (red circles) Great Lakes and the other on the Atlantic coast of Florida. Shaded spots are areas of precipitation. The blue circles locate the high pressures. The arrows indicate the trajectory. Credit: NOAA Central Library Data Imaging Project.
Current usage metrics show cumulative count of Article Views (full-text article views including HTML views, PDF and ePub downloads, according to the available data) and Abstracts Views on Vision4Press platform.
Data correspond to usage on the plateform after 2015. The current usage metrics is available 48-96 hours after online publication and is updated daily on week days.
Initial download of the metrics may take a while.