")
")
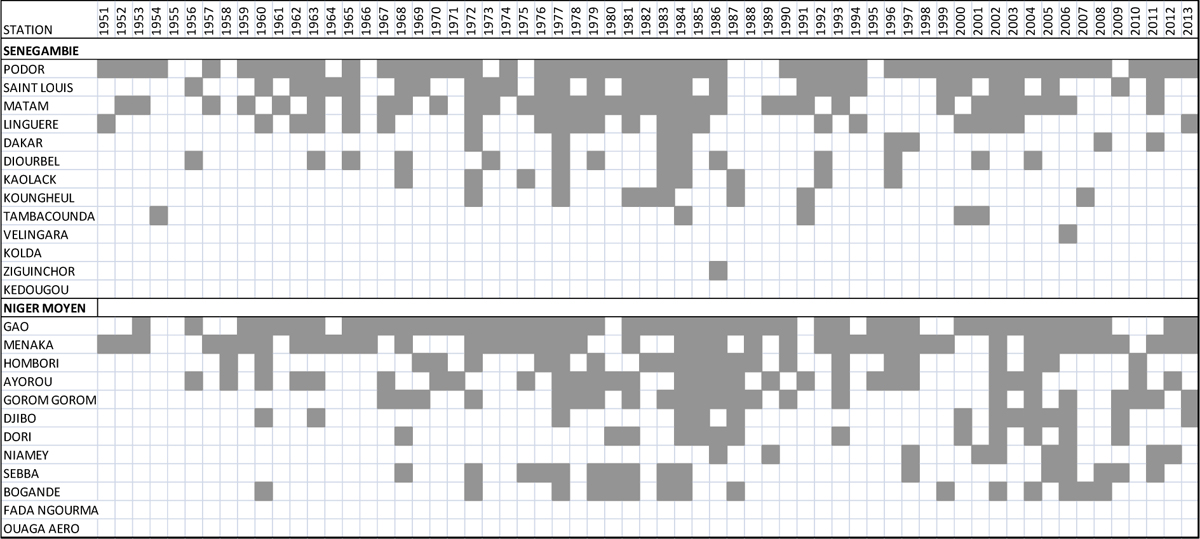
Tableau 2
Fréquence des moussons « ratées » (au sens de la normalité de la saisonnalité agroclimatique) ne s’étant pas produites suivant les critères de Sivakumar (1988) sur la période 1951-2013 : aucun évènement de plus de 20 mm ne s’est produit, qui n’ait pas été suivi pas au moins un épisode sec durant le premier mois qui l’a suivi; les cases grisées correspondent aux saisons « ratées » au niveau agronomique. Dans les deux fenêtres géographiques, les stations sont classées du Nord au Sud. Frequency of « false » monsoon occurrences, when Sivakumar (1988) criteria did not apply from 1951 to 2013: no rainfall event of more than 20 mm in 3 consecutive days, which were not followed by at least one dry period during the following first month; grey squares are “false” rainy seasons at the agronomic level. Within each one of the two areas, stations are classified from North to South.
Current usage metrics show cumulative count of Article Views (full-text article views including HTML views, PDF and ePub downloads, according to the available data) and Abstracts Views on Vision4Press platform.
Data correspond to usage on the plateform after 2015. The current usage metrics is available 48-96 hours after online publication and is updated daily on week days.
Initial download of the metrics may take a while.