")
")
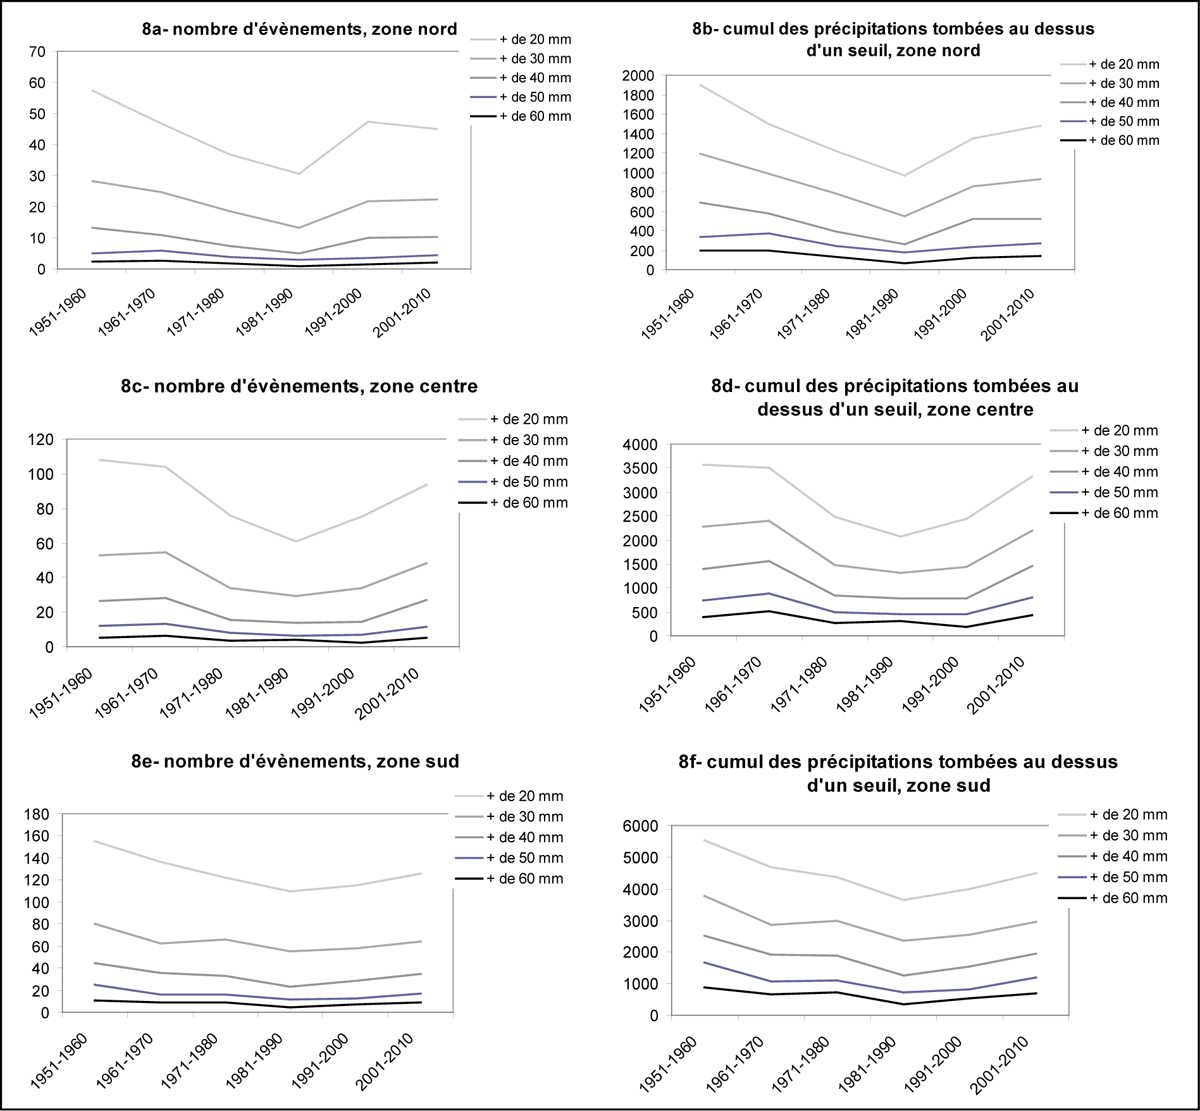
Figure 8
Download original image
L’évolution du nombre de jours de pluie (par seuil de hauteur de pluie) et du cumul des précipitations concernées, par sous-région : Nord (a et b), Centre (c et d), Sud (e et f). Evolution of the annual number of rainy days (per threshold of rainfall amount) and the rainfall cumulative amount, per sub-region: Northern (a and b), Central (c and d), Southern (e and f).
Current usage metrics show cumulative count of Article Views (full-text article views including HTML views, PDF and ePub downloads, according to the available data) and Abstracts Views on Vision4Press platform.
Data correspond to usage on the plateform after 2015. The current usage metrics is available 48-96 hours after online publication and is updated daily on week days.
Initial download of the metrics may take a while.