")
")
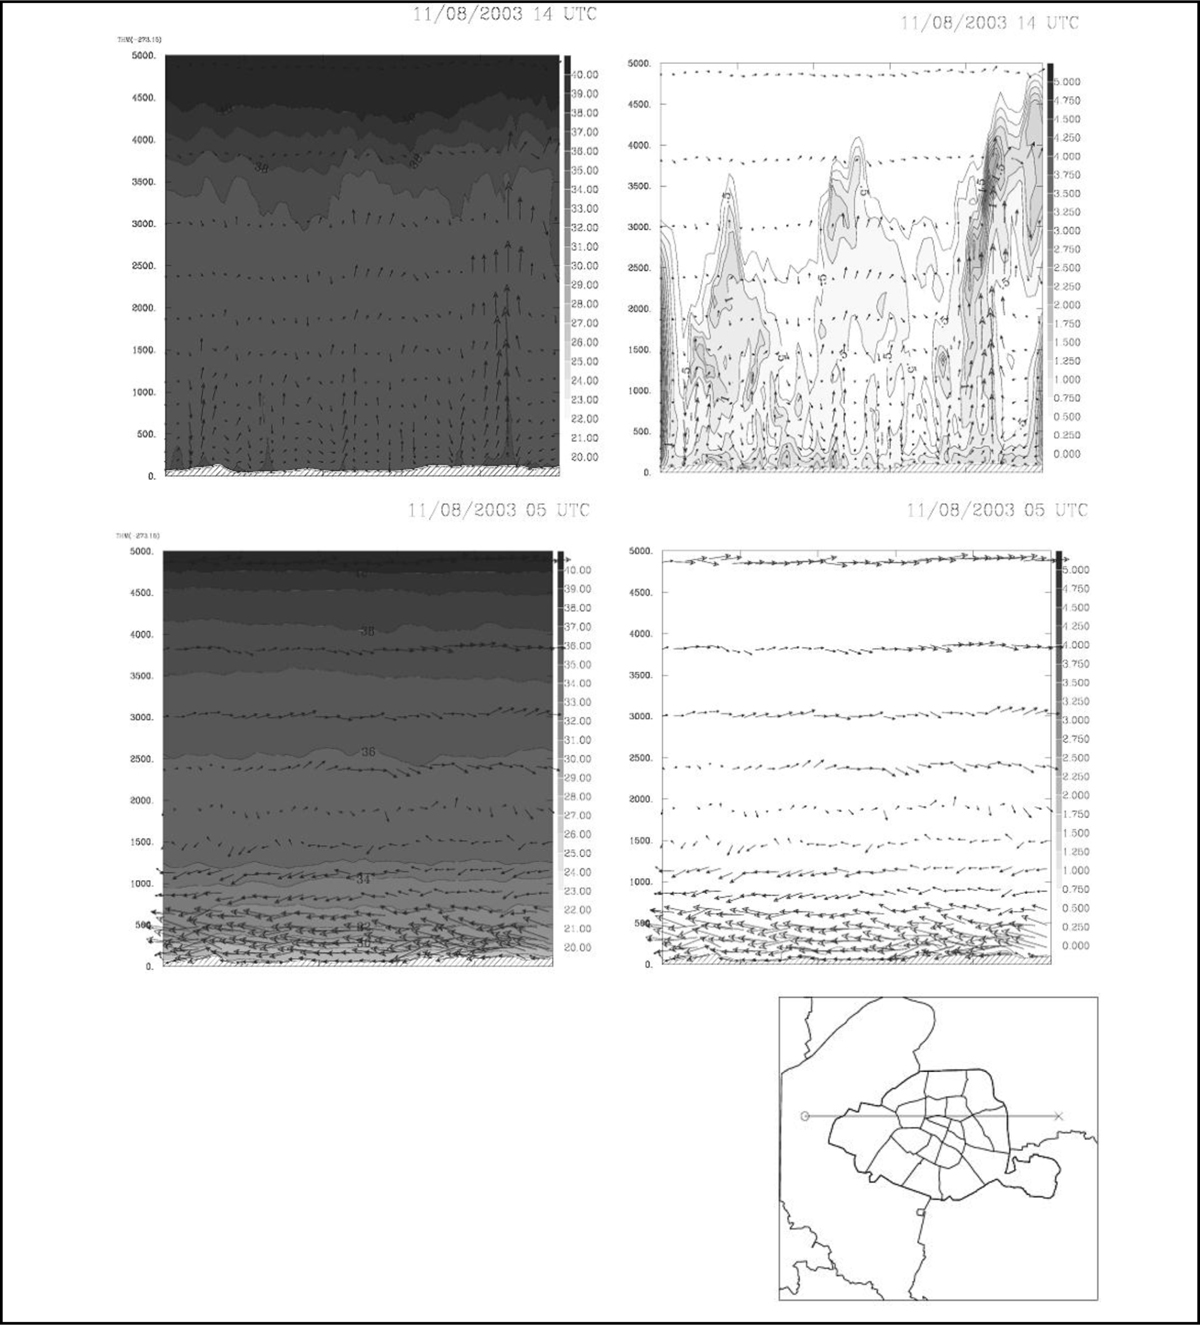
Figure 18
Download original image
Coupe verticale de température potentielle (°C) (à gauche) et d’énergie cinétique turbulente (à droite), auxquelles sont superposées les barbules de vent, simulée par le modèle le 11 août 2003 à 14 UTC et le 11 août 2003 à 05 UTC. La trace de la coupe verticale est montrée en bas. Vertical section of simulated potential temperature in °C (left) and turbulent kinetic energy (right) on 11 Aug. 14 UTC and 05 UTC; wind feathers are added. Localisation of the section is shown at the bottom.
Current usage metrics show cumulative count of Article Views (full-text article views including HTML views, PDF and ePub downloads, according to the available data) and Abstracts Views on Vision4Press platform.
Data correspond to usage on the plateform after 2015. The current usage metrics is available 48-96 hours after online publication and is updated daily on week days.
Initial download of the metrics may take a while.