")
")
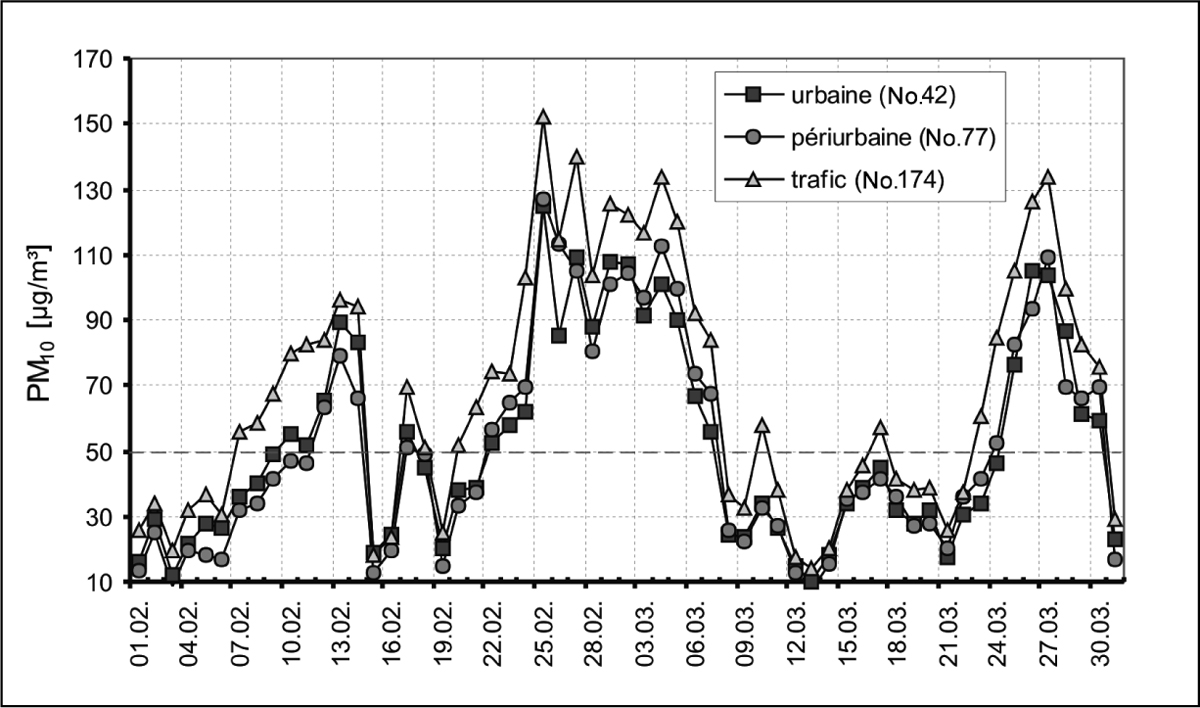
Figure 13
Download original image
Développement de la concentration de PM10 entre le 1er février et le 31 mars 2003 pendant un épisode de pollution élevée (données issues du réseau BLUME de la ville de Berlin). Development of PM10 daily averages from February to March 2003 in Berlin - period with highly elevated levels of PM10. Figure based on data provided by the official Berlin air quality monitoring network (BLUME).
Current usage metrics show cumulative count of Article Views (full-text article views including HTML views, PDF and ePub downloads, according to the available data) and Abstracts Views on Vision4Press platform.
Data correspond to usage on the plateform after 2015. The current usage metrics is available 48-96 hours after online publication and is updated daily on week days.
Initial download of the metrics may take a while.