")
")
Open Access
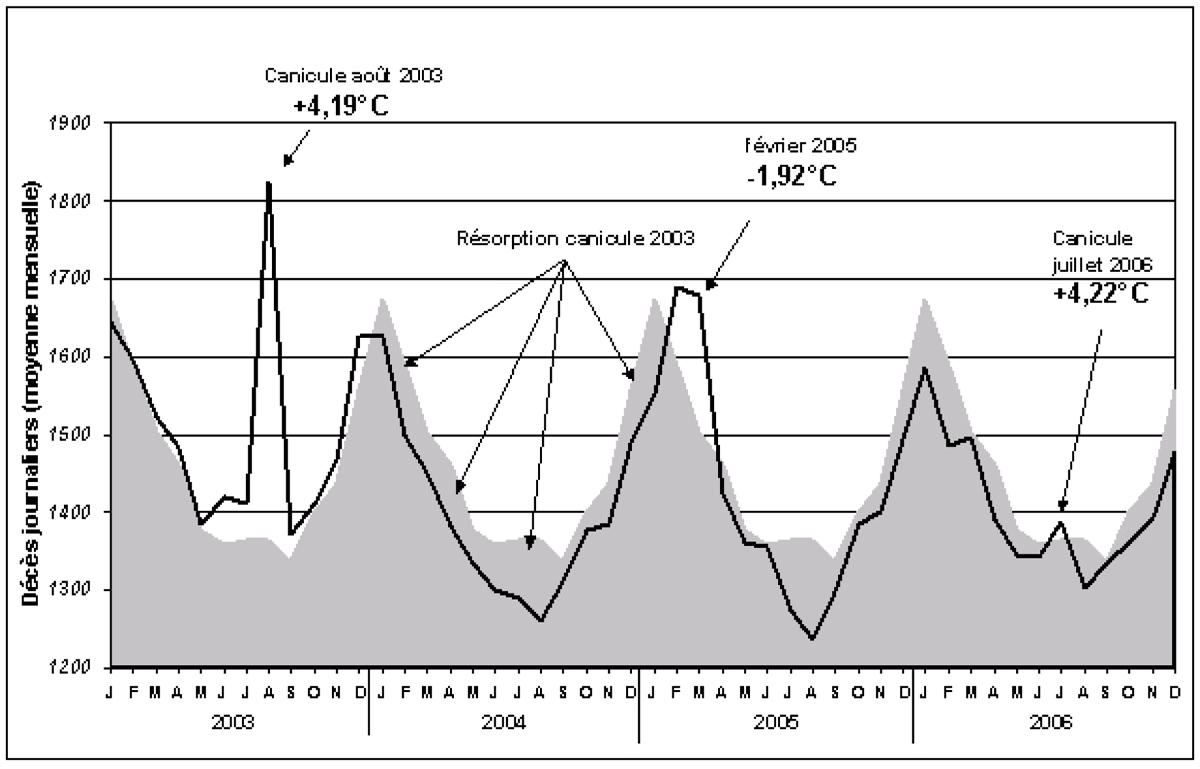
Figure 8
Download original image
Moyenne mensuelle des décès journaliers de janvier 2003 à décembre 2006 (trait noir) comparée à la moyenne 1990-2004 (en grisé) avec indication des anomalies remarquables de moyenne mensuelle de température. Mean daily mortality from January 2003 to December 2006 and 1990-2004 mean daily mortality.
Current usage metrics show cumulative count of Article Views (full-text article views including HTML views, PDF and ePub downloads, according to the available data) and Abstracts Views on Vision4Press platform.
Data correspond to usage on the plateform after 2015. The current usage metrics is available 48-96 hours after online publication and is updated daily on week days.
Initial download of the metrics may take a while.