")
")
Open Access
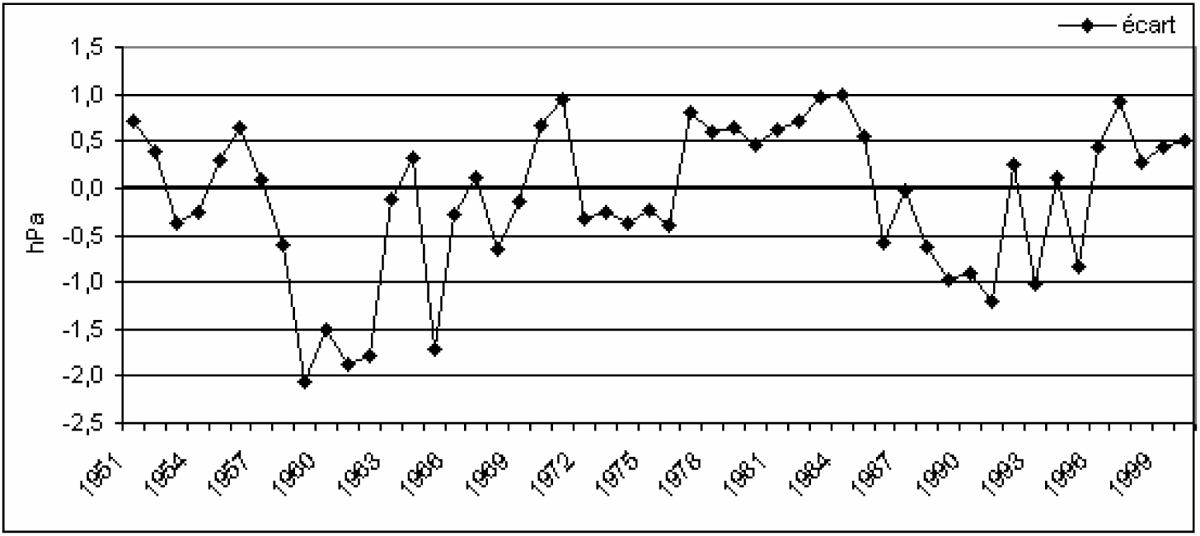
Figure 8
Download original image
Ecarts entre les pressions de surface réanalysées du point de grille 42,5N- 2,5E et celles observées à Perpignan en mars. Difference between reanalyzed sea level pressures at the 42,5N-2,5E grid point and observed pressures in Perpignan during March
Current usage metrics show cumulative count of Article Views (full-text article views including HTML views, PDF and ePub downloads, according to the available data) and Abstracts Views on Vision4Press platform.
Data correspond to usage on the plateform after 2015. The current usage metrics is available 48-96 hours after online publication and is updated daily on week days.
Initial download of the metrics may take a while.