")
")
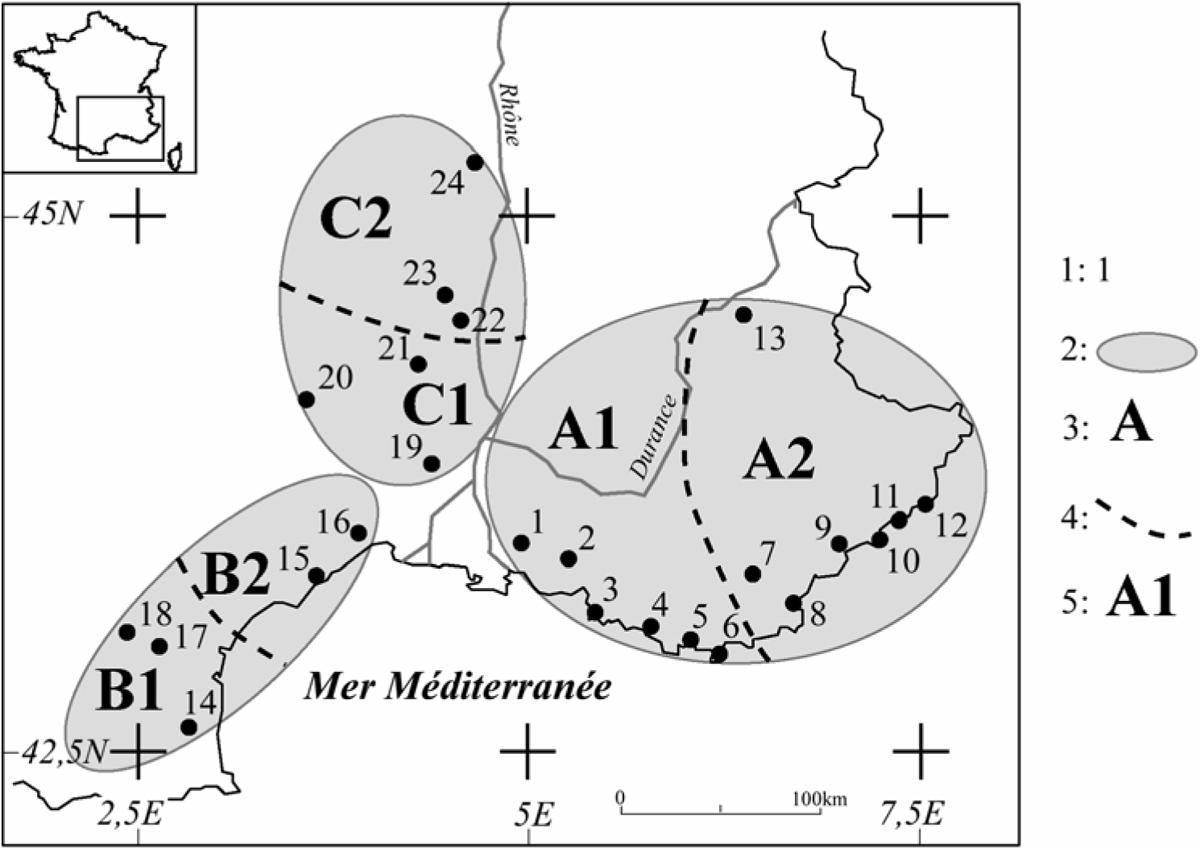
Figure 1
Download original image
Localisation des stations pluviométriques et des points de grille de pression au niveau de la mer. 1 : Stations 2 : Limite de régions 3 : Région 4 : Limite de subdivision régionale 5 : Subdivision régionale. Location of rainfall stations and sea level pressure grid points. 1 : Stations 2 : Region boundary 3 : Region 4 : Subregion boundary 5 : Subregion
Current usage metrics show cumulative count of Article Views (full-text article views including HTML views, PDF and ePub downloads, according to the available data) and Abstracts Views on Vision4Press platform.
Data correspond to usage on the plateform after 2015. The current usage metrics is available 48-96 hours after online publication and is updated daily on week days.
Initial download of the metrics may take a while.