")
")
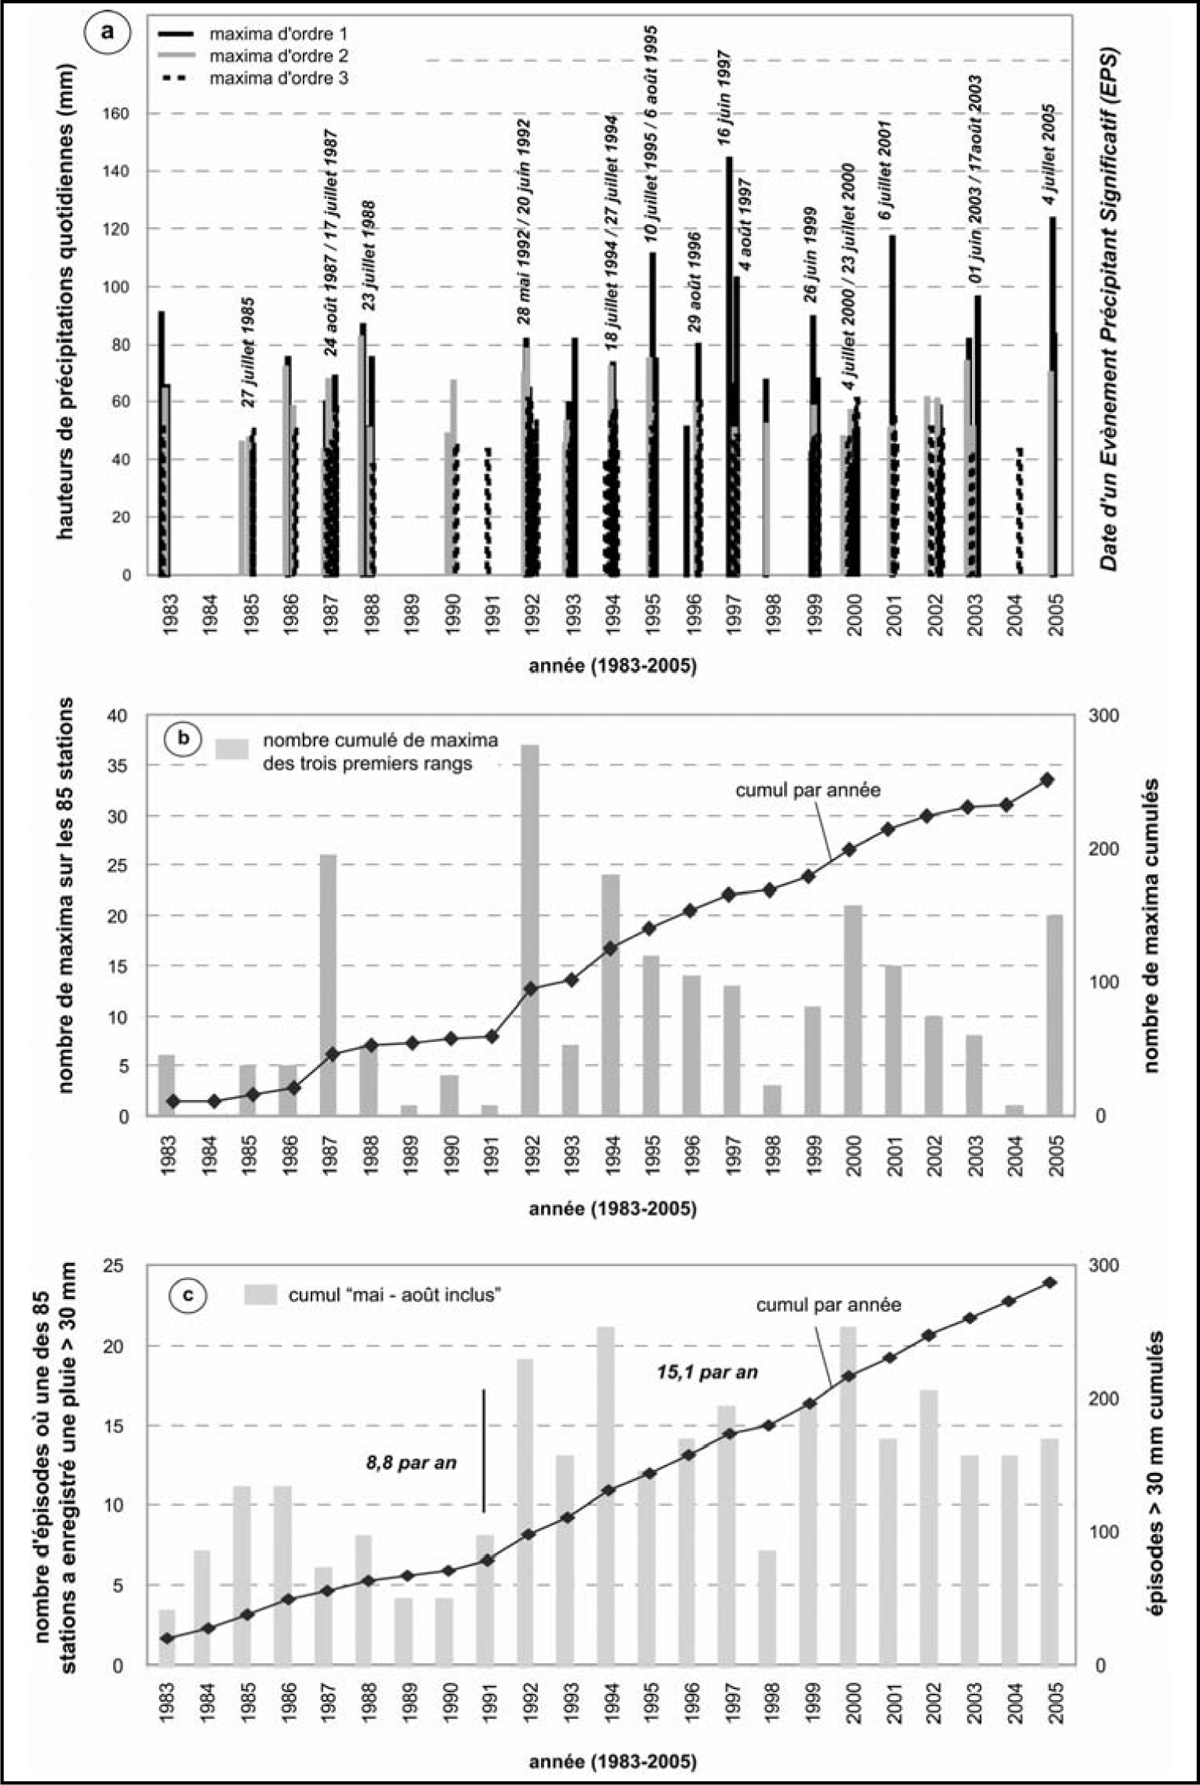
Figure 9
Download original image
Evolution de l’aléa pluviométrique sur la période 1983-2005 : a) répartition dans le temps des maxima de rang 1 et des Episodes Précipitants Significatifs (EPS); b) nombre de maxima observés sur la période 1983-2005 cumulés par année; c) cumul des jours de pluies > 30 mm. Rainfall hazard evolution from 1983 to 2005: a) distribution of the 1st maximum order value and of the Significant Rainfall Event (SRE); b) the cumulative number of the 3rd orders maxima registered on the 85 stations for each year; c) daily rains up to 30 mm.
Current usage metrics show cumulative count of Article Views (full-text article views including HTML views, PDF and ePub downloads, according to the available data) and Abstracts Views on Vision4Press platform.
Data correspond to usage on the plateform after 2015. The current usage metrics is available 48-96 hours after online publication and is updated daily on week days.
Initial download of the metrics may take a while.