")
")
Open Access
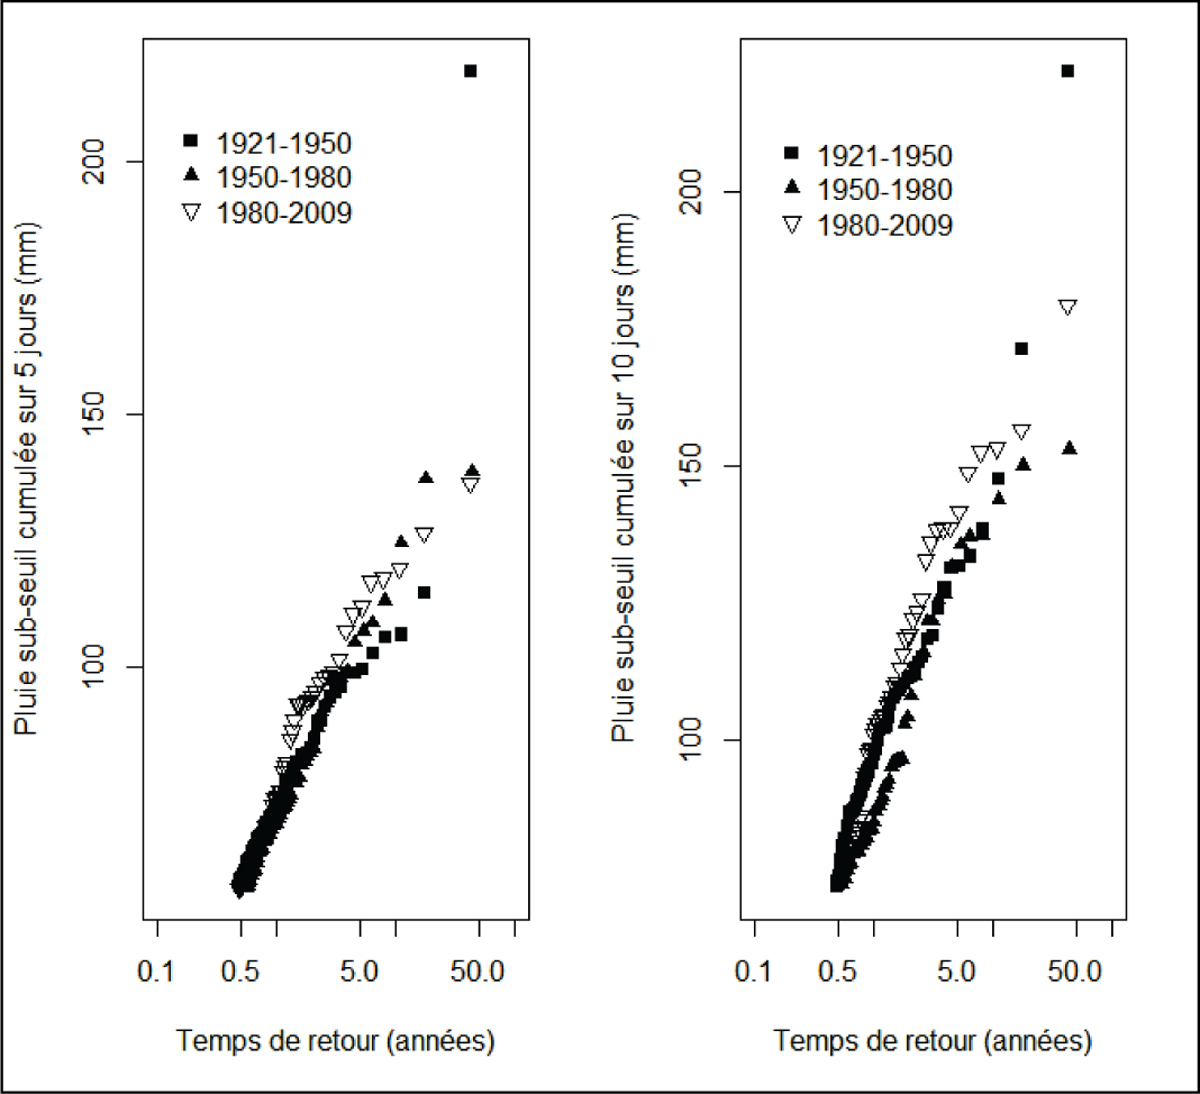
Figure 8
Download original image
Comparaison des distributions des pluies sub-seuils (échantillonnage à 2 épisodes par an) cumulées sur 5 jours et 10 jours. Comparison of the distributions of sub-threshold rainfall (sampling with two events per year) over 5 days and 10 days.
Current usage metrics show cumulative count of Article Views (full-text article views including HTML views, PDF and ePub downloads, according to the available data) and Abstracts Views on Vision4Press platform.
Data correspond to usage on the plateform after 2015. The current usage metrics is available 48-96 hours after online publication and is updated daily on week days.
Initial download of the metrics may take a while.