")
")
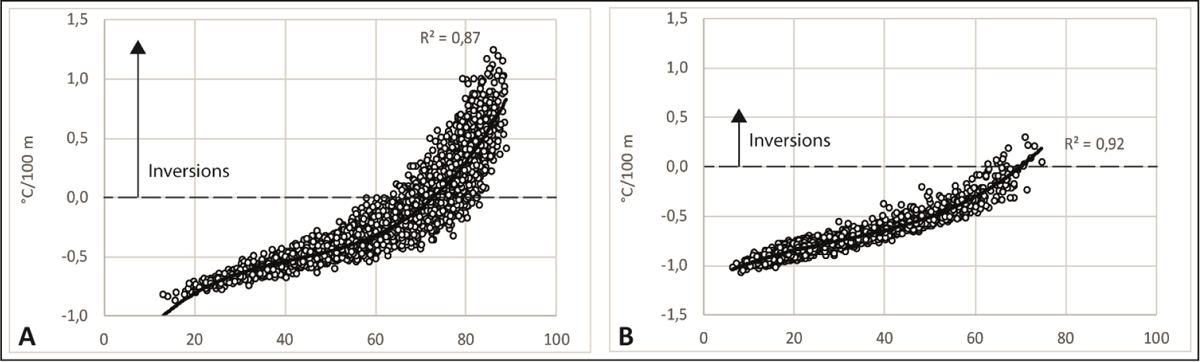
Figure 16
Download original image
Scatter plot of altitudinal temperature lapse rate °C/100 m (y-axis) versus inversion frequency. Each dot represents one of the 3653 days of the observation period 2008–2017. Frequency (%) of (A) tn-inversions and (B) tx-inversions. Diagramme de dispersion du gradient thermique altitudinal °C/100 m (axe des ordonnées) en fonction de la fréquence des inversions. Chaque point représente l’un des 3653 jours de la période d’observation 2008-2017. Fréquence (%) de A) tn-inversion et B) tx-inversion.
Current usage metrics show cumulative count of Article Views (full-text article views including HTML views, PDF and ePub downloads, according to the available data) and Abstracts Views on Vision4Press platform.
Data correspond to usage on the plateform after 2015. The current usage metrics is available 48-96 hours after online publication and is updated daily on week days.
Initial download of the metrics may take a while.