")
")
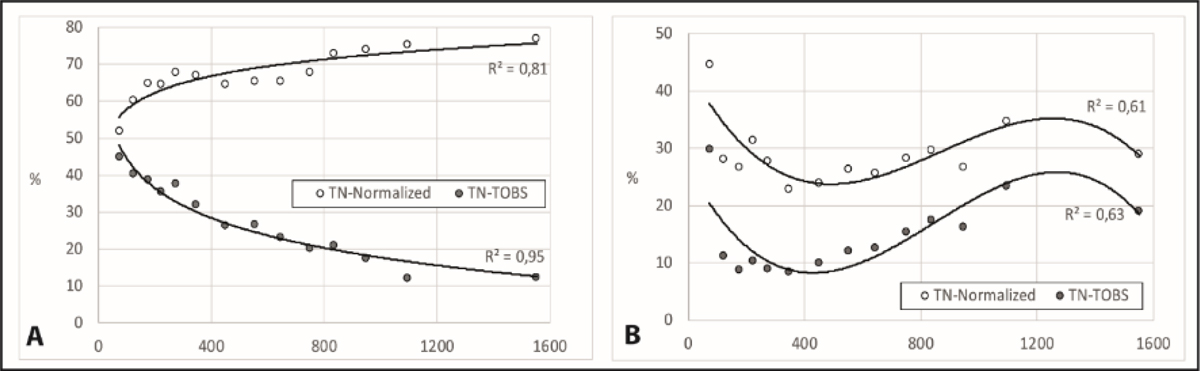
Figure 13
Download original image
Scatter plot between altitudinal differences in meters (x-axis) versus (A) tn-inversion frequency and (B) tx-inversion frequency according to whether the high station temperature is corrected (TN-Normalized) or not (TN-Obs.). Diagramme de dispersion entre les différences altitudinales en mètres (axe des abscisses) en fonction de A) la fréquence des inversions tn et B) la fréquence des inversions tx selon que la température de la station haute est corrigée (TN-normalized) ou non (TN-Obs.).
Current usage metrics show cumulative count of Article Views (full-text article views including HTML views, PDF and ePub downloads, according to the available data) and Abstracts Views on Vision4Press platform.
Data correspond to usage on the plateform after 2015. The current usage metrics is available 48-96 hours after online publication and is updated daily on week days.
Initial download of the metrics may take a while.