Open Access
Figure 3

Download original image
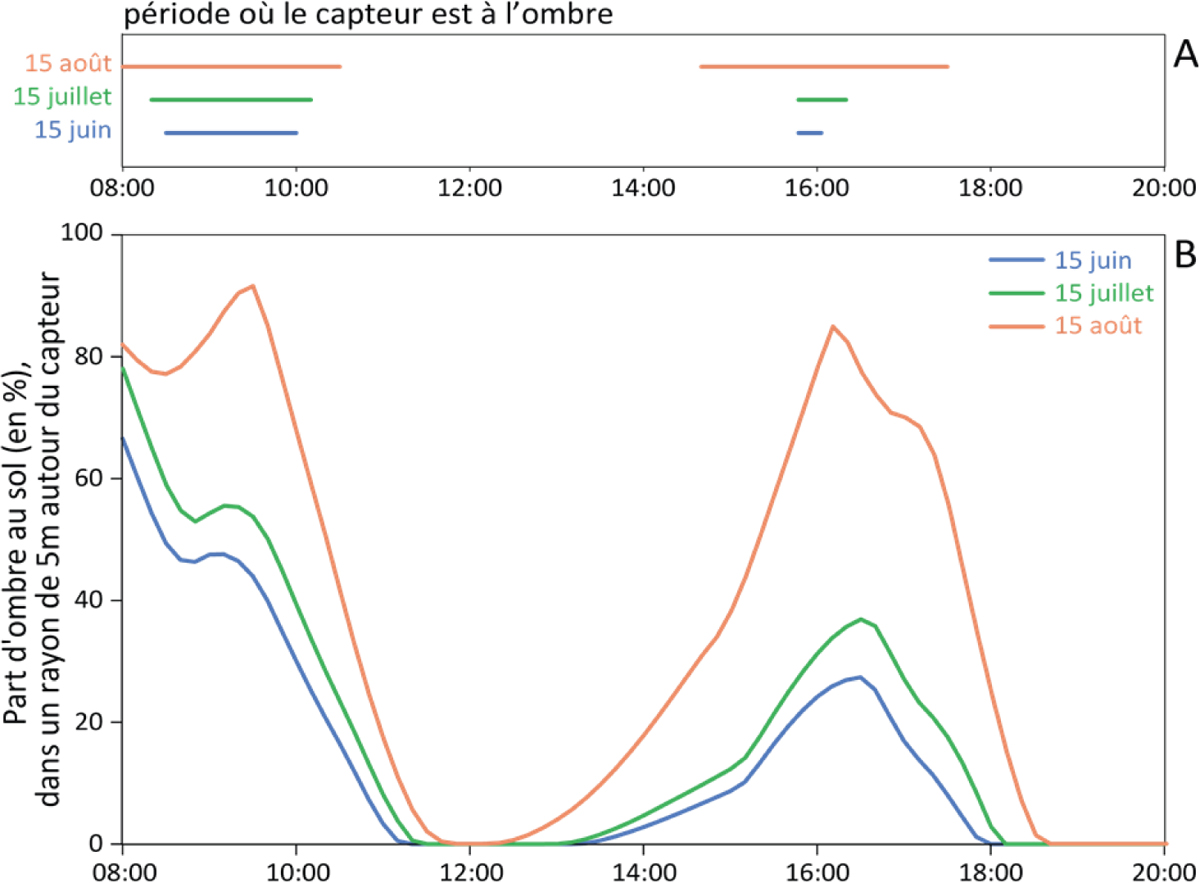
Simulation de l’ombre au niveau du capteur de température pour les trois dates estivales (A) et pourcentage des surfaces ombragées dans un rayon de 5 m autour du capteur (B). Simulation of the shadow at the temperature sensor for the three summer dates (A) and percentage of shaded areas within 5m of the sensor (B).
Current usage metrics show cumulative count of Article Views (full-text article views including HTML views, PDF and ePub downloads, according to the available data) and Abstracts Views on Vision4Press platform.
Data correspond to usage on the plateform after 2015. The current usage metrics is available 48-96 hours after online publication and is updated daily on week days.
Initial download of the metrics may take a while.


