")
")
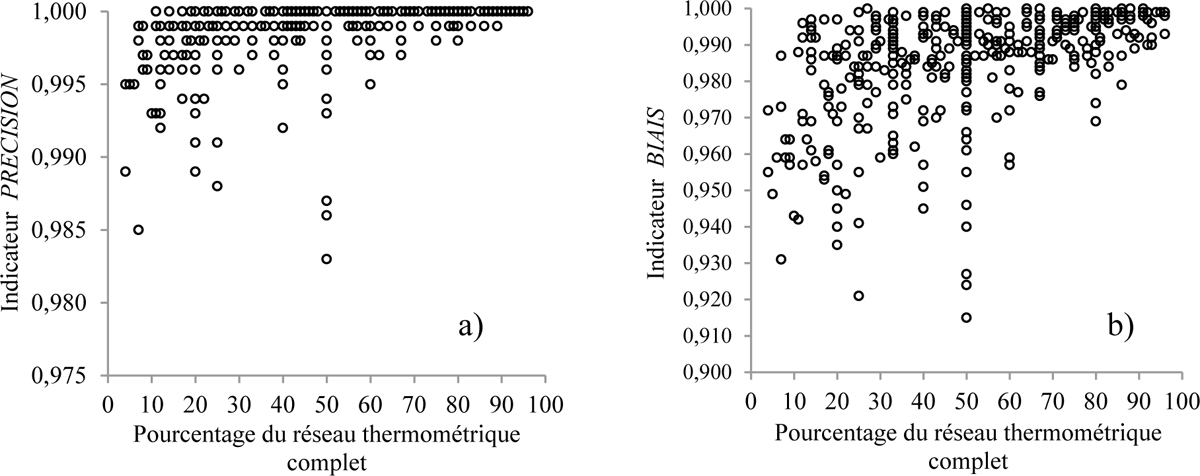
Figure 8
Download original image
Evolution des indicateurs PRECISION (a) et BIAIS (b) en fonction du pourcentage de réduction du réseau thermométrique complet. Les résultats sont donnés pour la période de calage 1993-1997. Values of the PRECISION and the BIAIS indices according to the reduction of the weather stations network. Results are given for the calibration period (1993-1997).
Current usage metrics show cumulative count of Article Views (full-text article views including HTML views, PDF and ePub downloads, according to the available data) and Abstracts Views on Vision4Press platform.
Data correspond to usage on the plateform after 2015. The current usage metrics is available 48-96 hours after online publication and is updated daily on week days.
Initial download of the metrics may take a while.