")
")
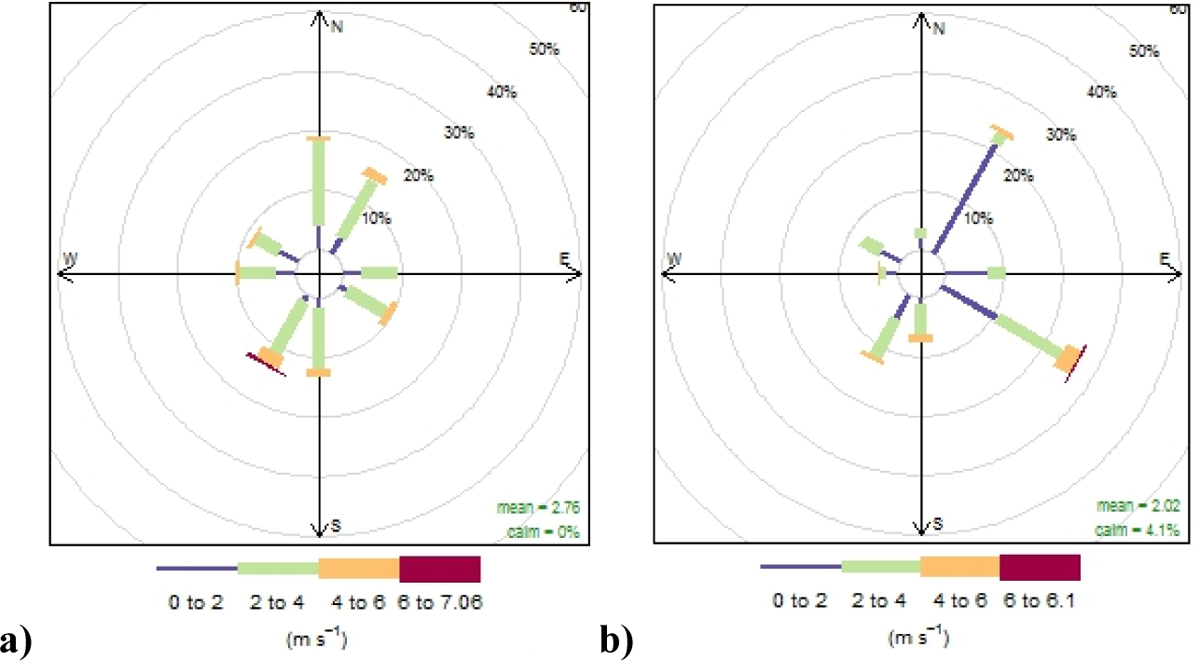
Figure 6
Download original image
Fréquence et intensité des vents par secteur à la station INIA Las Brujas (a) et Punta Yegua (b) - moyenne pour la période de novembre à février 2014, pendant les heures plus chaudes du jour (13 h à 15 h). Wind frequency and velocity per sector at the INIA Las Brujas station (a) and Punta Yegua station (b) - average for the November - February 2014 period, during the hottest hours of the day (13:00 to 15:00).
Current usage metrics show cumulative count of Article Views (full-text article views including HTML views, PDF and ePub downloads, according to the available data) and Abstracts Views on Vision4Press platform.
Data correspond to usage on the plateform after 2015. The current usage metrics is available 48-96 hours after online publication and is updated daily on week days.
Initial download of the metrics may take a while.