")
")
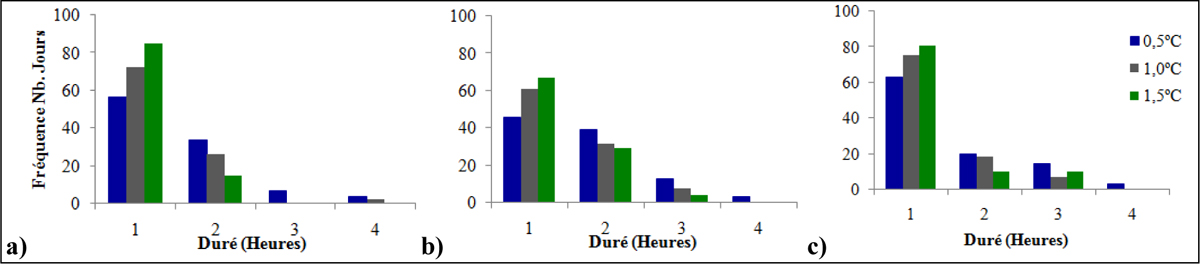
Figure 15
Download original image
Fréquences des nombres de jours avec des chutes de températures d’intensité différentes (0,5, 1 et 1,5°C) au moment du maximum journalier et durée de l’évènement (en heures) pour trois capteurs de la région : Plot 1 (a), Plot 5 (b) et Plot 10 (c); moyenne des trois saisons étudiées. Frequency of days with temperature decreases of different intensity (0.5, 1 and 1.5°C) at the time of diurnal maximum and duration of the event (in hours) for three plots of the wine region: Plot1 (a), Plot5 (b) and Plot10 (c); average for the three studied seasons.
Current usage metrics show cumulative count of Article Views (full-text article views including HTML views, PDF and ePub downloads, according to the available data) and Abstracts Views on Vision4Press platform.
Data correspond to usage on the plateform after 2015. The current usage metrics is available 48-96 hours after online publication and is updated daily on week days.
Initial download of the metrics may take a while.