")
")
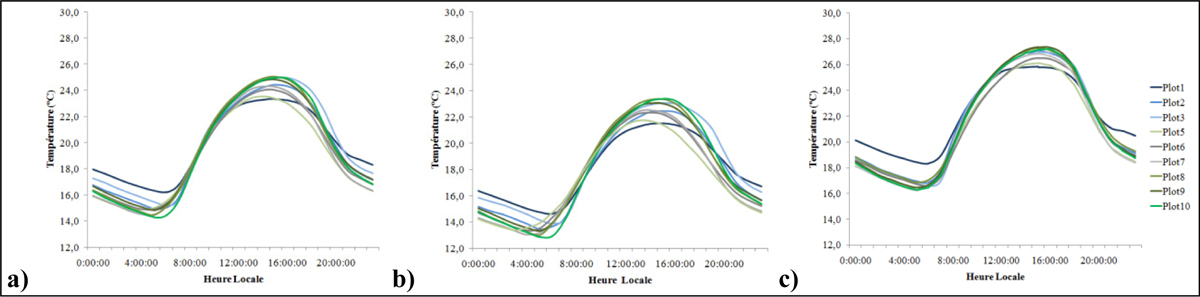
Figure 13
Download original image
Température horaire dans chaque parcelle pendant (a) la saison végétative de la vigne, de septembre à février, (b) la saison pré-véraison, de septembre à décembre et (c) la saison post-véraison, de janvier à mars; moyenne des trois saisons étudiées (2011-12, 2012-13 et 2013-14). Hourly temperature in each plot during (a) the vine growing season, from September to March; (b) the pre-veraison season, from September to December; and (c) the post-veraison season, from January to March; average for the three studied seasons (2011-12, 2012-13 and 2013-14).
Current usage metrics show cumulative count of Article Views (full-text article views including HTML views, PDF and ePub downloads, according to the available data) and Abstracts Views on Vision4Press platform.
Data correspond to usage on the plateform after 2015. The current usage metrics is available 48-96 hours after online publication and is updated daily on week days.
Initial download of the metrics may take a while.