")
")
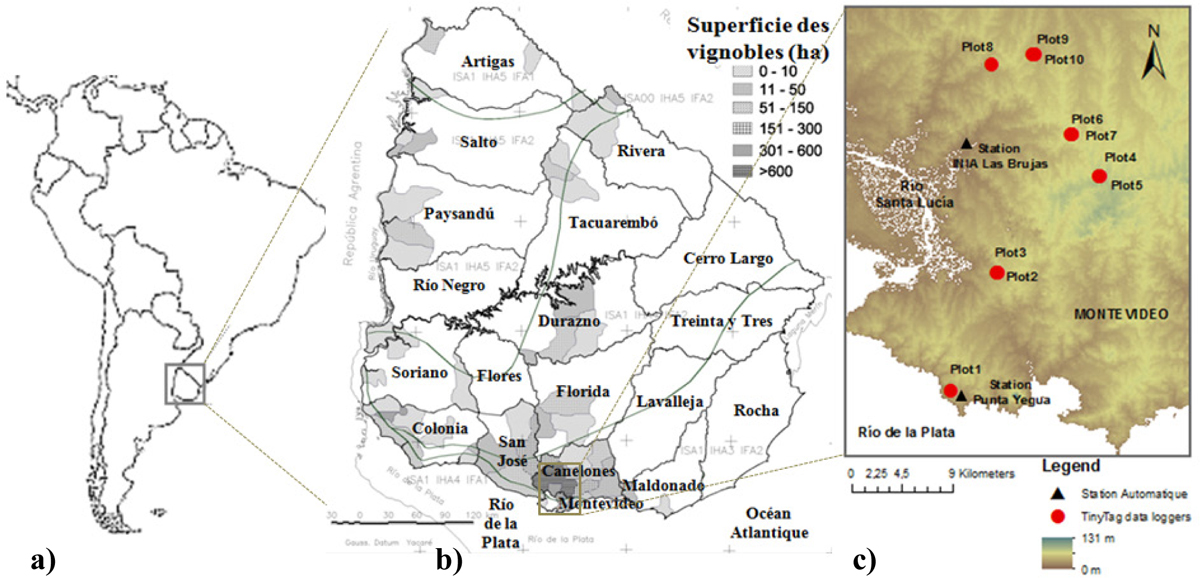
Figure 1
Download original image
Cadre géographique de la région étudiée : situation à l’échelle a) de l’Amérique du Sud; b) de l’Uruguay et de ses régions viticoles (d’après Ferrer, 2007) et c) de la région viticole de Montevideo et Canelones (avec localisation du réseau de capteurs thermiques et des stations automatiques météorologiques INIA Las Brujas et Punta Yegua; source : ArcGIS). Studied area: location a) at the South American scale; b) at the Uruguayan scale and wine producing regions and c) at the scale of the wine region of Montevideo and Canelones with location of the TinyTag data loggers and the automatic meteorological stations of INIA Las Brujas and Punta Yegua (Map source: ArcGIS).
Current usage metrics show cumulative count of Article Views (full-text article views including HTML views, PDF and ePub downloads, according to the available data) and Abstracts Views on Vision4Press platform.
Data correspond to usage on the plateform after 2015. The current usage metrics is available 48-96 hours after online publication and is updated daily on week days.
Initial download of the metrics may take a while.