")
")
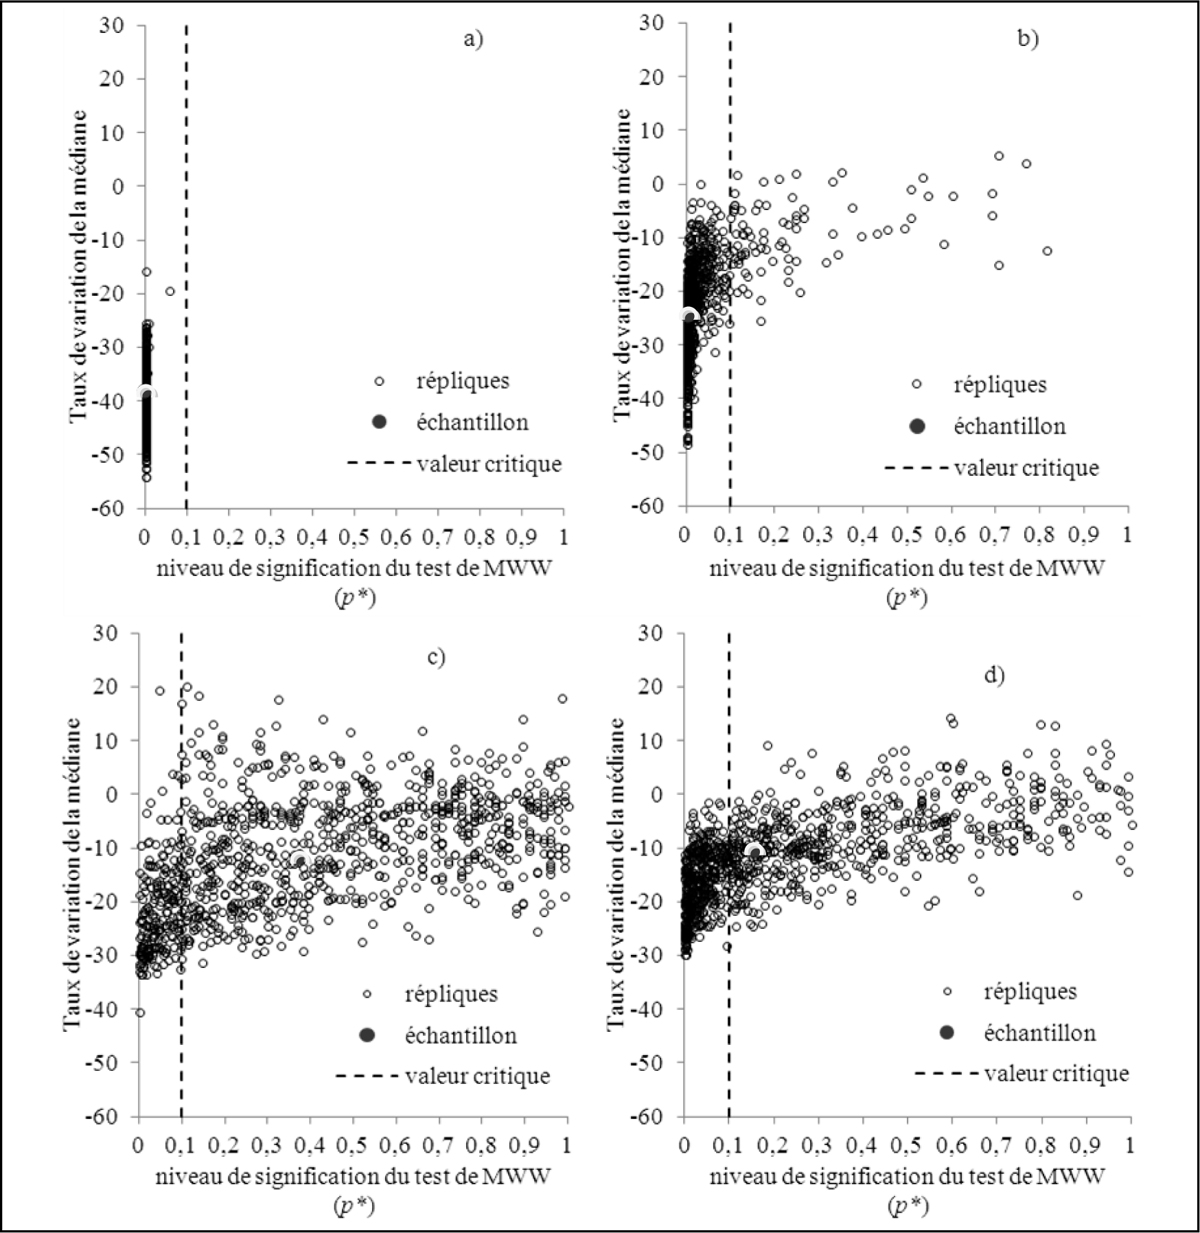
Figure 19
Download original image
Relation entre le niveau de signification du test U de Mann-Withney-Wilcoxon (risque αlocal de 0,1) et le taux de variation de la médiane des précipitations saisonnières (1971-2000 vs. 2071-2100). Les résultats sont fournis pour l’échantillon de données et les 1000 répliques générées par boostrap-années. a) Eté; b) Automne; c) Hiver; d) Printemps. Point de grille SAFRAN de coordonnées 50.176 N/4.070 E, scénario d’émission A2. Relationship between the p-values of the MWW test and the rate of seasonal rainfall median change (1971-2000 vs 2071-2100). I-type error of 0.1. Results are given for the data sample as well as the 1000 replicates generated through boostrap resampling. a) Winter; b) Summer; c) Autumn; d) Spring. Coordinates of the SAFRAN grid point: 4.070 E/50.176 N. Emission scénario A2.
Current usage metrics show cumulative count of Article Views (full-text article views including HTML views, PDF and ePub downloads, according to the available data) and Abstracts Views on Vision4Press platform.
Data correspond to usage on the plateform after 2015. The current usage metrics is available 48-96 hours after online publication and is updated daily on week days.
Initial download of the metrics may take a while.