")
")
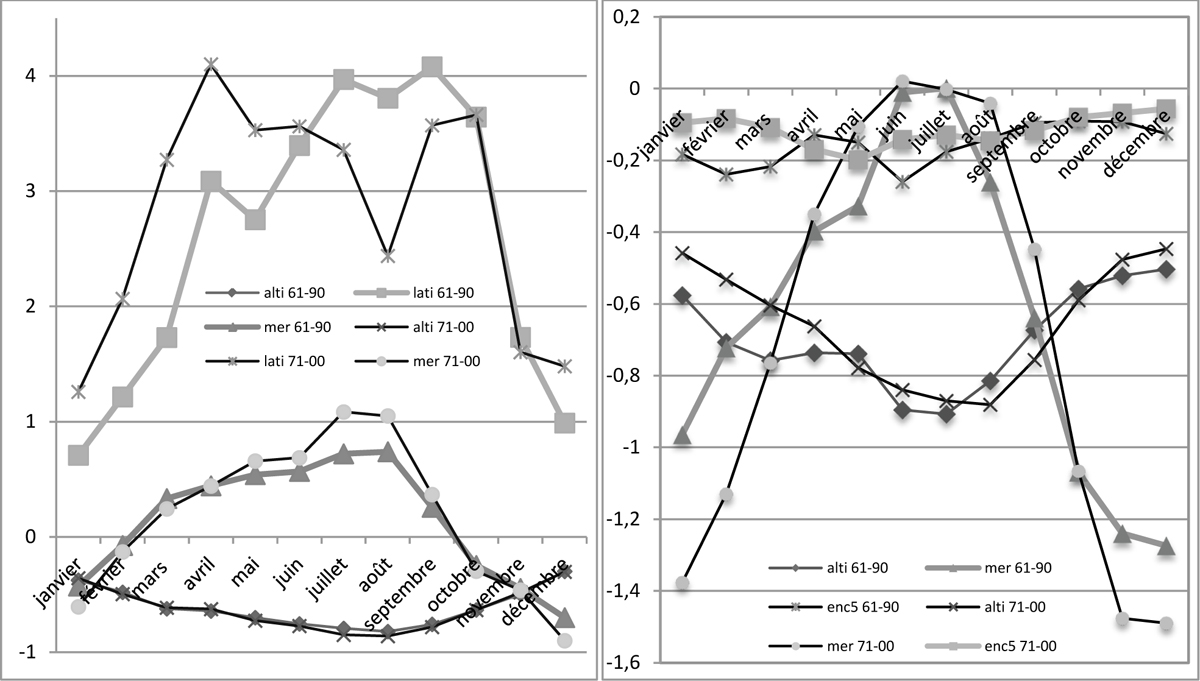
Figure 7
Download original image
Evolution mensuelle comparée des gradients thermiques commandés par les trois principaux prédicteurs des Tx (à gauche) et des Tn (à droite) pour la période 1961-1990 et la période 2071-2100, scénario A1B. Compared monthly evolution of the thermal gradients commanded by the three main predictors of Tx (left) and Tn (right) for the reference period 1961-1990 and the period 2071-2100.
Current usage metrics show cumulative count of Article Views (full-text article views including HTML views, PDF and ePub downloads, according to the available data) and Abstracts Views on Vision4Press platform.
Data correspond to usage on the plateform after 2015. The current usage metrics is available 48-96 hours after online publication and is updated daily on week days.
Initial download of the metrics may take a while.