")
")
Open Access
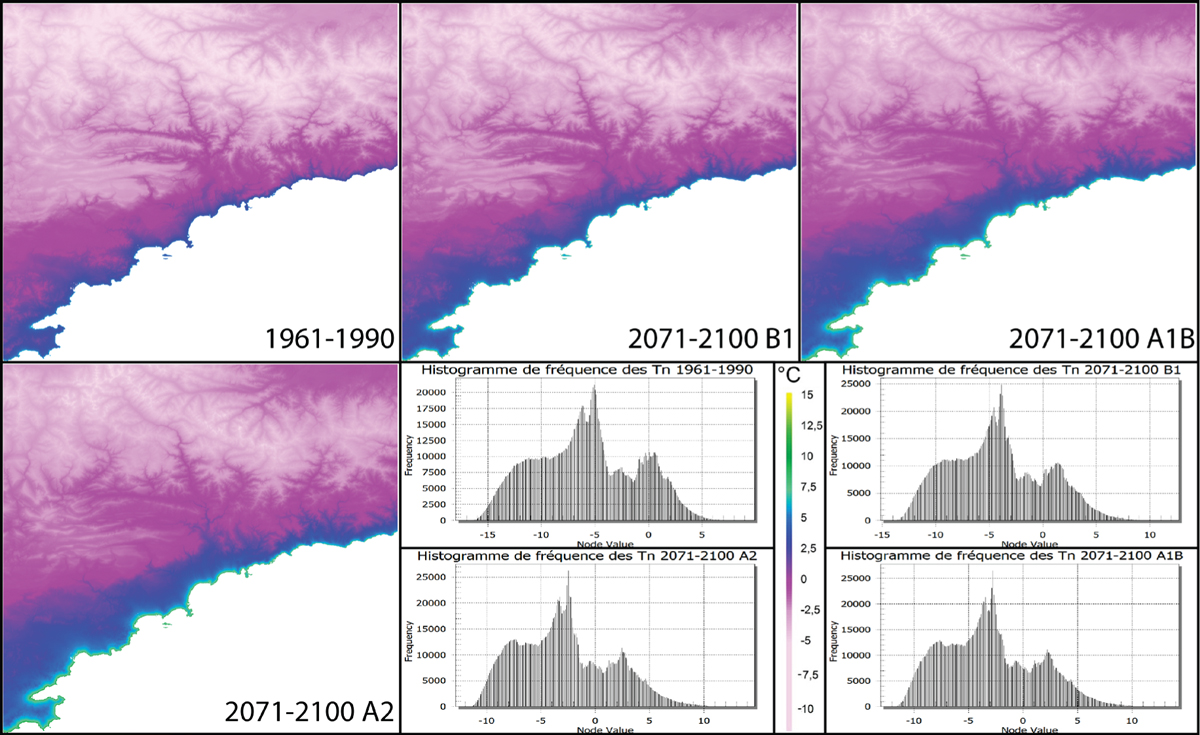
Figure 11
Download original image
Cartes et histogrammes de fréquence des températures minimales de janvier 1961-1990 et janvier 2071-2100 pour les scénarios B1, A1B et A2. Maps and histograms frequency of the minimal temperatures of January 1961-1990 and January 2071-2100 for the B1, A1B and A2 scenarios.
Current usage metrics show cumulative count of Article Views (full-text article views including HTML views, PDF and ePub downloads, according to the available data) and Abstracts Views on Vision4Press platform.
Data correspond to usage on the plateform after 2015. The current usage metrics is available 48-96 hours after online publication and is updated daily on week days.
Initial download of the metrics may take a while.