")
")
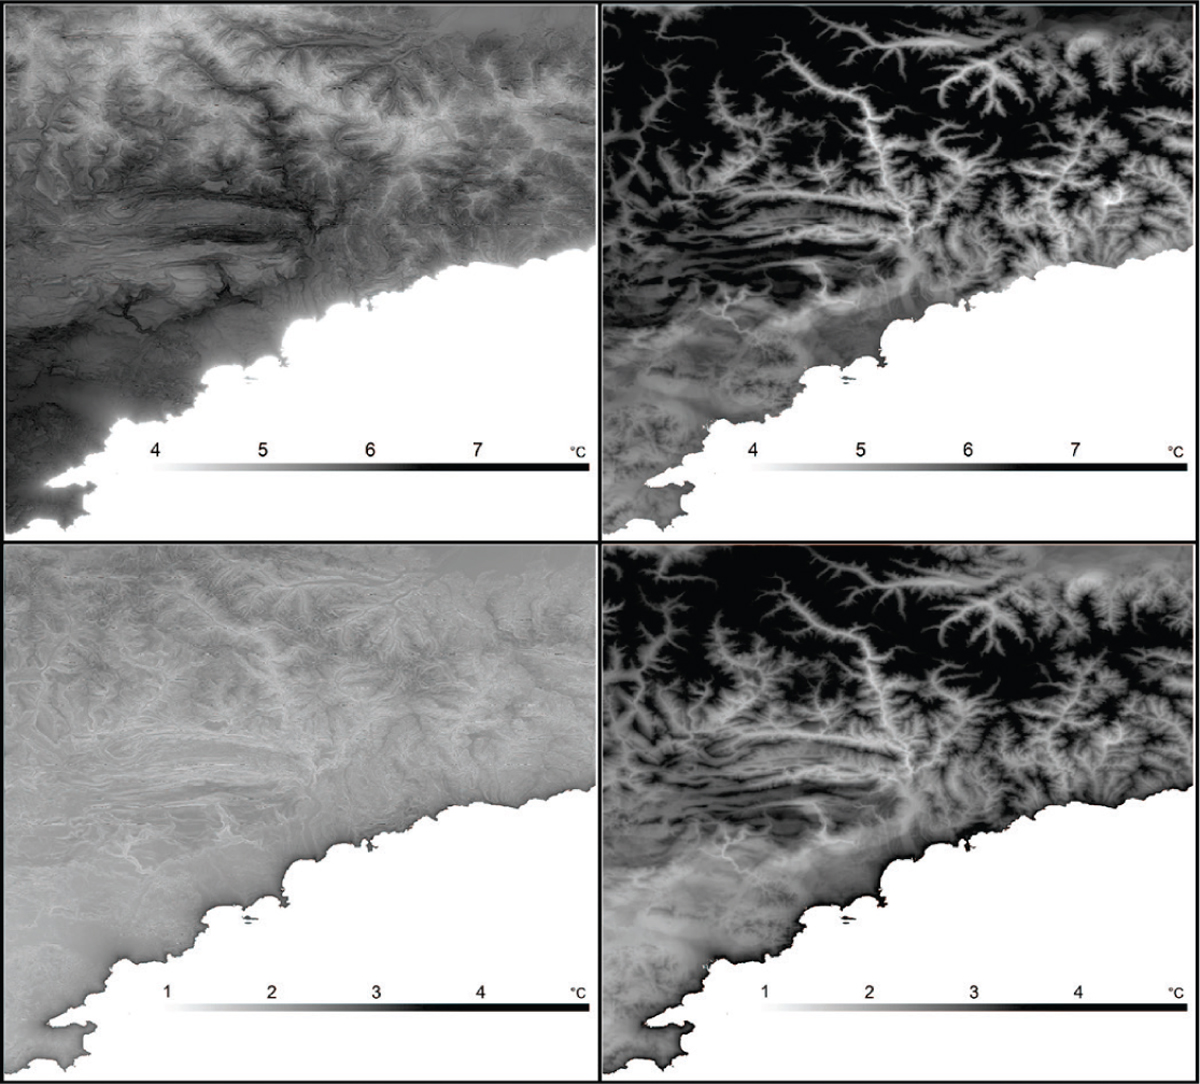
Figure 10
Download original image
Spatialisation de la hausse, en degrés Celsius par rapport à la période 1961-1990, des Tx (à gauche) et des Tn (à droite) de juillet (en haut) et de janvier (en bas) dans les Alpes-Maritimes pour 2071-2100 et selon le scénario A2. Spatializing of the increase, in degree Celsius compared to the reference period 1961-1990, for the Tx (left) and for the Tn (right) in July (at the top) and in January (below) in the Alpes-Maritimes for 2071-2100 according to the A2 scenario.
Current usage metrics show cumulative count of Article Views (full-text article views including HTML views, PDF and ePub downloads, according to the available data) and Abstracts Views on Vision4Press platform.
Data correspond to usage on the plateform after 2015. The current usage metrics is available 48-96 hours after online publication and is updated daily on week days.
Initial download of the metrics may take a while.