")
")
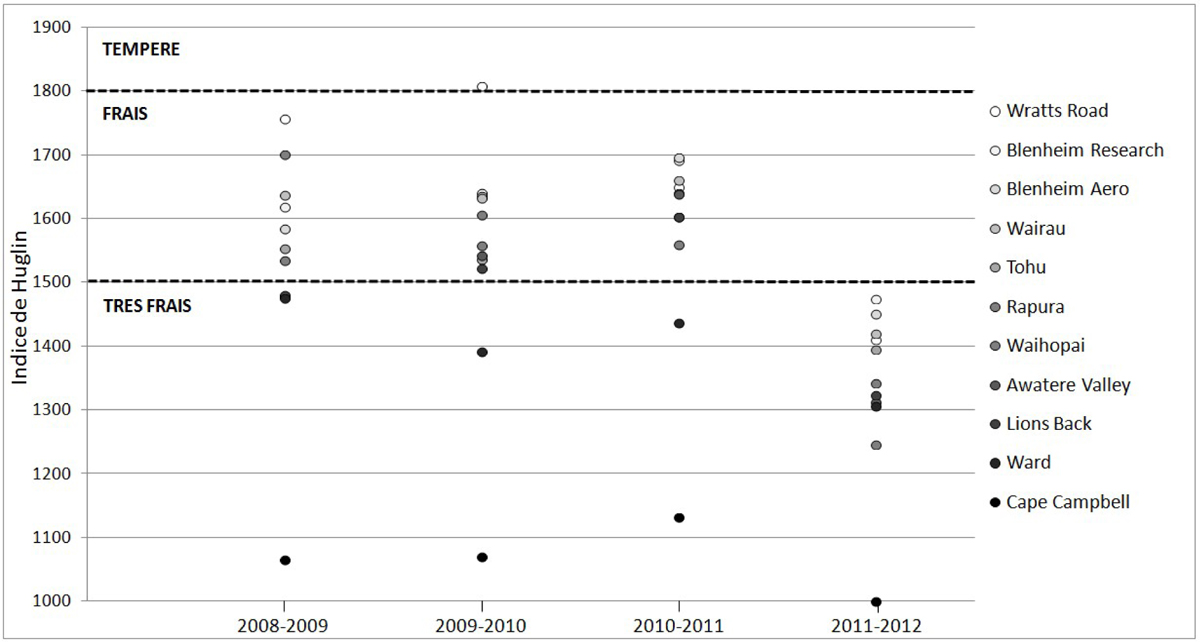
Figure 10
Download original image
Indices d’Huglin des 11 stations analysées sur la période 2008-2012 et climats viticoles associés. Le dégradé de gris dans la légende rend compte de la hiérarchisation associée à la moyenne des valeurs sur la période : e.g. Wratts Road a la moyenne des valeurs d’indice de Huglin la plus élevée sur la période 2008-2012, Cape Campbell la plus basse. Huglin index values of the 11 weather stations analysed over the 2008-2012 period and related viticultural climates. The average index value was calculated for the whole period 2008-2012 for each station, the grey gradient in the legend reflects the hierarchy associated with this average: e.g. Wratts Road got the highest Huglin index average over the 2008-2012 period, Cape Campbell the lowest.
Current usage metrics show cumulative count of Article Views (full-text article views including HTML views, PDF and ePub downloads, according to the available data) and Abstracts Views on Vision4Press platform.
Data correspond to usage on the plateform after 2015. The current usage metrics is available 48-96 hours after online publication and is updated daily on week days.
Initial download of the metrics may take a while.