")
")
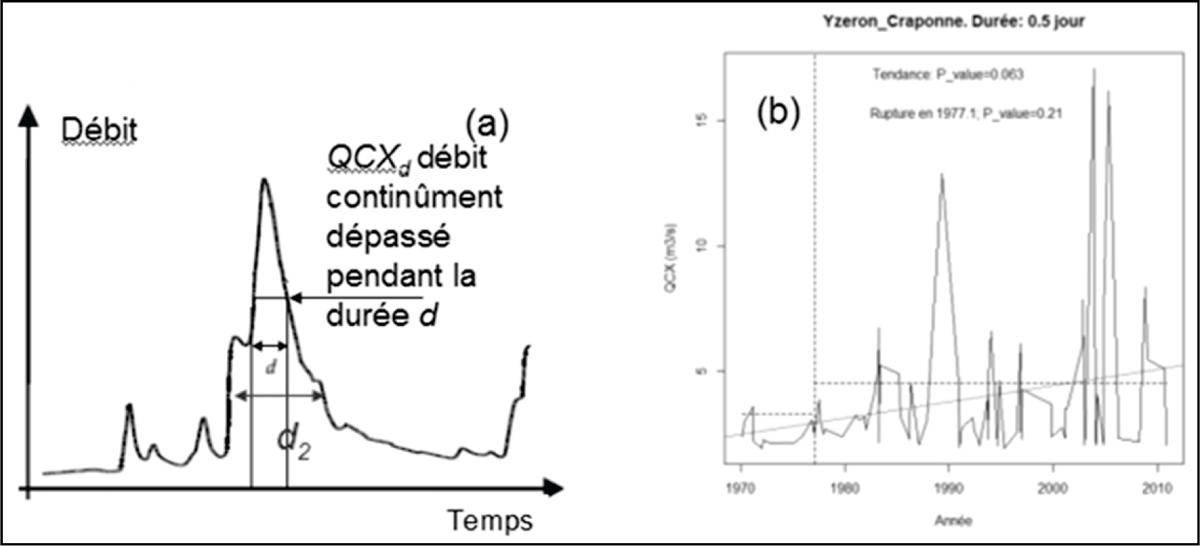
Figure 4
Download original image
a) Principe de la méthode d’échantillonnage des débits sub-seuil. On déplace une fenêtre de largeur d le long de la chronique et on sélectionne les crues indépendantes. On peut faire ce travail pour une autre durée d2. b) Analyse des débits de crue sub-seuils à Craponne pour la durée d=12 h. Les lignes pointillées horizontales marquent respectivement les moyennes sur les périodes avant et après rupture, marquée par la ligne pointillée verticale. La droite en pointillés est la tendance linéaire ajustée sur les données. a) Principle of the sampling method for the QdF analysis. A time window of width d is moved along the time series and independent flood events are selected. The same analysis can be done for a second duration d2. b) Analysis of sub-threshold flood discharges at Craponne for the duration d=12h. The horizontal dotted lines shows the average before and after the rupture date, indicated with the vertical dotted line. The dashed line is the linear trend adjusted on the data.
Current usage metrics show cumulative count of Article Views (full-text article views including HTML views, PDF and ePub downloads, according to the available data) and Abstracts Views on Vision4Press platform.
Data correspond to usage on the plateform after 2015. The current usage metrics is available 48-96 hours after online publication and is updated daily on week days.
Initial download of the metrics may take a while.