")
")
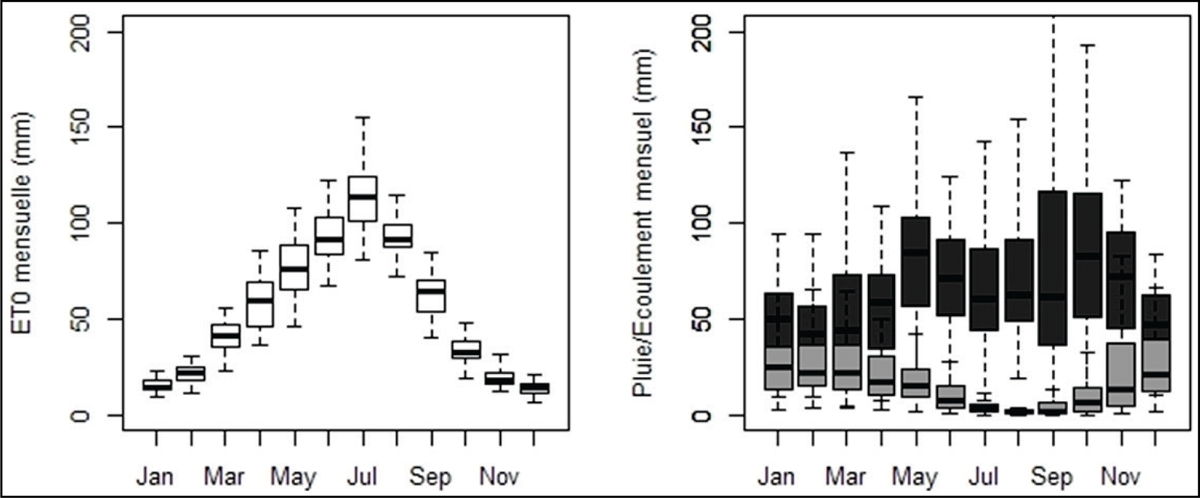
Figure 3
Download original image
Moyennes mensuelles interannuelles (mm) de l’évapotranspiration de référence (ET0) en blanc (graphique de gauche), des précipitations en gris foncé (graphique de droite), calculées à l’aide des données SAFRAN (1970-2010), des écoulements en gris clair (graphique de droite), calculées à l’aide des données de la station de Craponne (1970-2010). Interannual monthly average (mm) of reference evapotranspiration (ET0) in white (at left), rainfall in dark gray (at right), computed using the SAFRAN data (1970-2010), runoff in light gray (at right), computed using the Craponne gauge data (1970-2010).
Current usage metrics show cumulative count of Article Views (full-text article views including HTML views, PDF and ePub downloads, according to the available data) and Abstracts Views on Vision4Press platform.
Data correspond to usage on the plateform after 2015. The current usage metrics is available 48-96 hours after online publication and is updated daily on week days.
Initial download of the metrics may take a while.