")
")
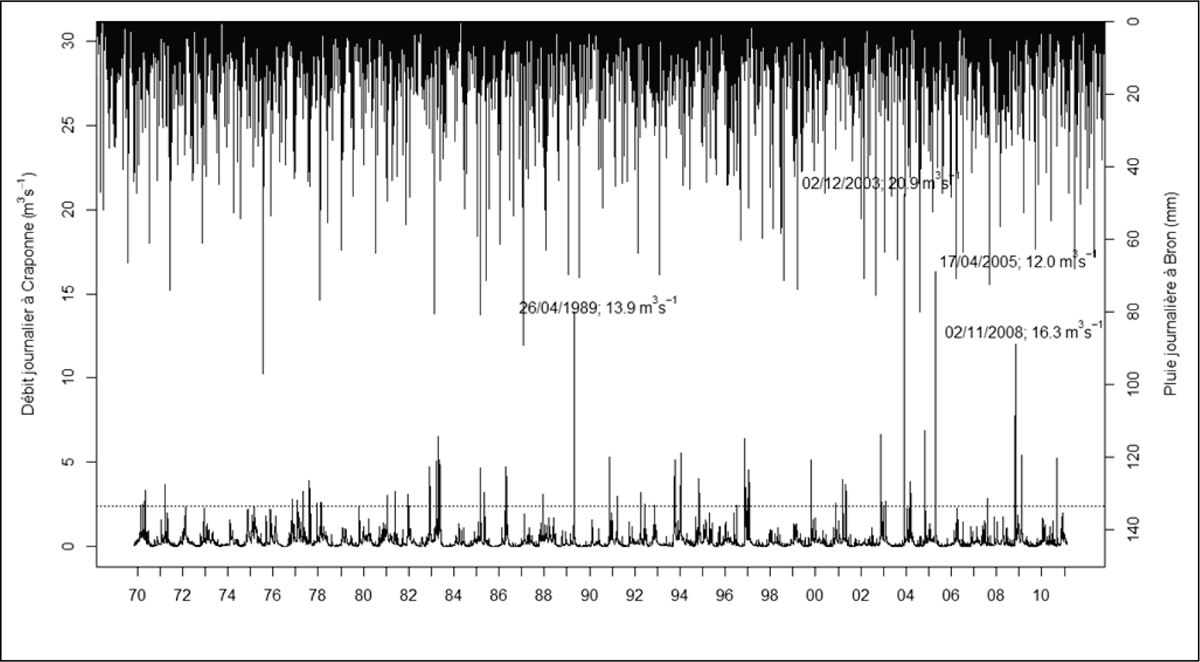
Figure 2
Download original image
Evolution des pluies journalières (pluie moyenne de bassin calculée à l’aide des réanalyses SAFRAN) et des débits journaliers à la station de Craponne (48 km2) pour la période 1970-2010. La ligne pointillée horizontale représente le débit journalier dépassé 1% du temps. Time series of the daily rainfall (catchment average from the SAFRAN reanalyses) and of the daily discharge at Craponne (48 km2) over the 1970-2010 period. The horizontal dashed line is the daily discharge exceeded 1% of the time.
Current usage metrics show cumulative count of Article Views (full-text article views including HTML views, PDF and ePub downloads, according to the available data) and Abstracts Views on Vision4Press platform.
Data correspond to usage on the plateform after 2015. The current usage metrics is available 48-96 hours after online publication and is updated daily on week days.
Initial download of the metrics may take a while.